


1. Introduction
Acoustics started to be studied as a science at the beginning of the 20th century (Beranek, 1992). Before that date, the design of acoustic spaces was based on a combination of trial and error and copying the shape and proportions of other previous successful venues. The reverberation time was the first parameter used to analyze the acoustic of a space. The reverberation time depends on the shape and size of the enclosure, the materials used in the construction of the room, and the way they are built. Some designers of the time ignored the influence that the shape and the proportions of the room have. Because of that, they only paid attention to the reverberation time, which has proven to be insufficient for an adequate acoustic design. Between 1900 and 1950 the importance given to the shape of concert halls and theaters decayed. There are some design aspects, especially in proscenium theaters, that are often taken for granted despite their relevance in architectural acoustics. A tight design in longitudinal section with deep boxes keeps the room volume small, providing a low reverberation time and limiting the distance from the last row to the stage, which is desirable, both visually and acoustically (Barron & Foulkes, 1994).
This work is part of a broader investigation carried out in the Centro de Tecnologías Físicas, Universidad Politécnica de Valencia, Valencia, Spain. The research involves performing acoustic measurements in theaters and create acoustic models of them to study the behavior of the determined surfaces. Theaters located in the region of Valencia have been selected mainly due to the quality and number of available spaces, the proximity, and the operability (each measurement takes approximately between 3 and 4 hours).
The region of Valencia has a long musical tradition. Almost every city has at least one musical society, (there are more than 400 concert bands [Ruiz Monrabal, 1993]). It is common for these societies to have their own facilities or even a small auditorium. Sometimes, these spaces are proper musical auditoriums, but usually, they are multifunctional spaces in which it is possible to host other activities related to scenic arts besides music.
In the late 70s, the city of Valencia suffered a decrease in the number of venues for theater exhibitions. That can be explained by a decrease in the public interest in those kinds of artistic representations, and by the rise of other media spaces such as cinemas. Because of that, some theaters were transformed into cinemas, others changed activity, and others were closed. Even so, the city of Valencia has more than a dozen theaters, of different importance. Some of those theaters built in the mid-nineteenth and early twentieth centuries are still functioning today. Some notable examples are the Principal, the Olympia, and the Talía. Some new venues have been built in the last decades, such as the Palau de la Música (music hall), the Palau de les Arts (opera house), and some smaller spaces such as La Rambleta (theater), the Catarroja Auditorium.
We have extensively measured and collected data from several theaters. Among them are three of the oldest and most important theaters that are still operative in the City of Valencia. Those theaters are the Principal Theater, the Olympia Theater, and the Talía Theater. All of them are roughly from the same period. The Principal Theater is the oldest and the largest of the three. The Olympia Theater and Talía Theater share most of their physical characteristics, dimensions, and materials. The main difference between them is the volume of the room. The reason why these theaters have been selected is the significance those venues have in terms of cultural heritage for the city of Valencia. It is also relevant to analyze how the acoustic parameters of those theaters differ and interlink depending on the characteristics mentioned in previous paragraphs.
Researchers presented in the past their criteria to evaluate or classify the quality of a venue (Arau-Puchades, 1999; Beranek, 2004; Knudsen, 1931). Since the main parameters we wanted to compare are related to the dimensions, the Beranek methodology can be considered the most adequate in this case. The Beranek methodology describes several parameters that allow displaying the data of each space in a very concise way that enable the comparison between the differences and similarities of the rooms under study.
The combination of differences and similarities usually leads to the obtention of relevant conclusions in terms of the architectural acoustic design.
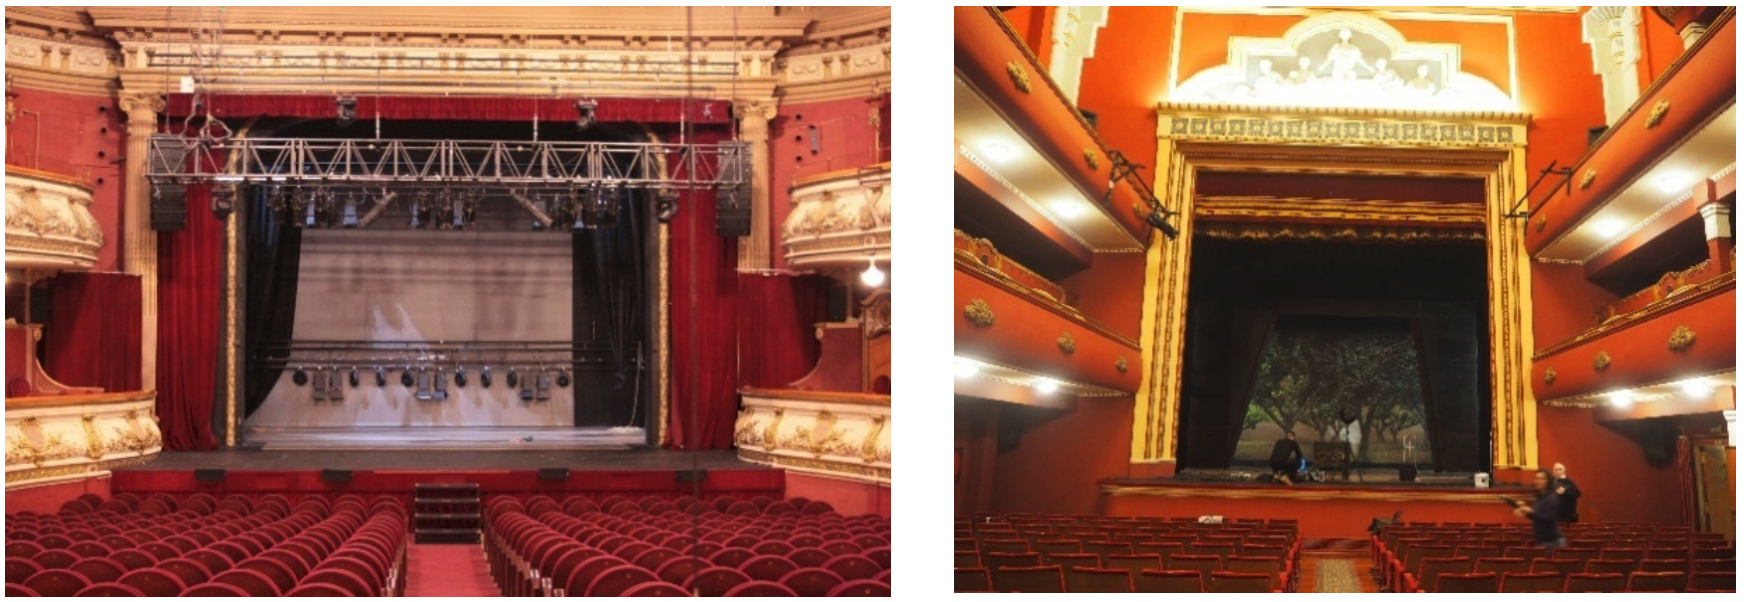
The Olympia Theatre was designed by the architect Vicente Rodríguez Martín in 1915 (Fig. 1 and 2). It is located in a building block that also includes commercial spaces. Those commercial spaces and the Theatre itself are set on the ground floor and first floor. The apartments are placed on the upper floors. The composition of the building stands out from the rest because of its formal unity. Its style belongs to what was called the International Decorative style (Colomer Sendra, 2002).


The auditorium has a long shape with a slight slope. It has two floors with balconies on both of them. The access to the ground floor balconies is located at each side of the room. The first floor is accessed through a central marble stair. The side corridors give access to the balconies and the regular seats. It is also worth mentioning that the building in which the Olympia Theater is set was one of the first buildings in Valencia to use metallic riveted structure and smelted columns. The walls that surround the theatre are made of solid ceramic brick. The floors, in general, are made of tongue and groove wooden floorboards. In the stalls, a carpet has been placed on the circulation spaces. Also, while the floor stage is arranged on a wooden structure, the first floor is set on a structural slab. The wall cladding is made with plaster, except for the entrance area on the ground floor, where there are several fabric wall frames, and on the back area of the first floor, which maintains the appearance of plaster but with a hollow wall solution. The suspended ceiling is made of reed with plaster, and the back of the room is equipped with an acoustically treated ceiling. The central area has a false skylight and metal structure, backlit. The ledge of the balconies and the perimeter of the ceiling are decorated with plaster moldings. The list of the materials used in the room can be seen in Table 1.
The Talía Theatre was designed by the architect Javier Goerlich Lleó in 1927 (Fig. 3 and 4). It belongs to the catholic charitable institution "Casa de los Obreros de San Vicente Ferrer (Herreras & Rodríguez, 2008) and it was originally connected to the building next to it: the offices of the “casa de los Obreros”. It has seats on the ground floor and first floor and three levels of balconies. The flooring is made of tongue and groove wooden floorboard on the stalls and stage, and it is covered by carpets on the first floor. The balconies have hydraulic tile flooring. The walls have plaster coatings in general, and near to the room entrance, plasterboard with an air chamber. The ceiling of the theater is made of plaster on fastening strips. The ledge of the balconies and the perimeter of the ceiling are decorated with plaster moldings, in a similar way as in the Olympia Theater. The list of the materials used in the Thalia theater can be seen in Table 2.
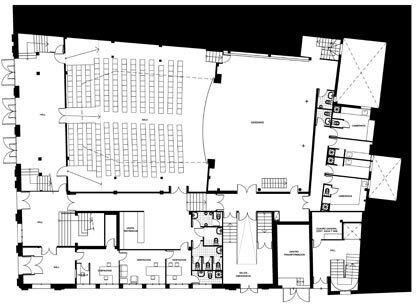
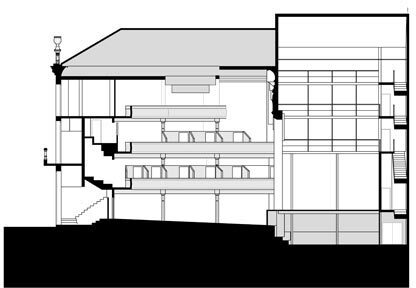
Both theaters were restored by the architect Carlos Montesinos. The Talía Theater was restored in 1995 and the Olympia Theater in 2000 (Fig. 5). The main goal of this paper is to study the influence that the characteristics that differ from one theatre to the other may have on the acoustic parameters of the room. To prevent the cross effect, the interaction of several parameters acting simultaneously, we chose a pair of theaters that share most of their characteristics.
_and_tala_theater_(right).png)
2. Methods
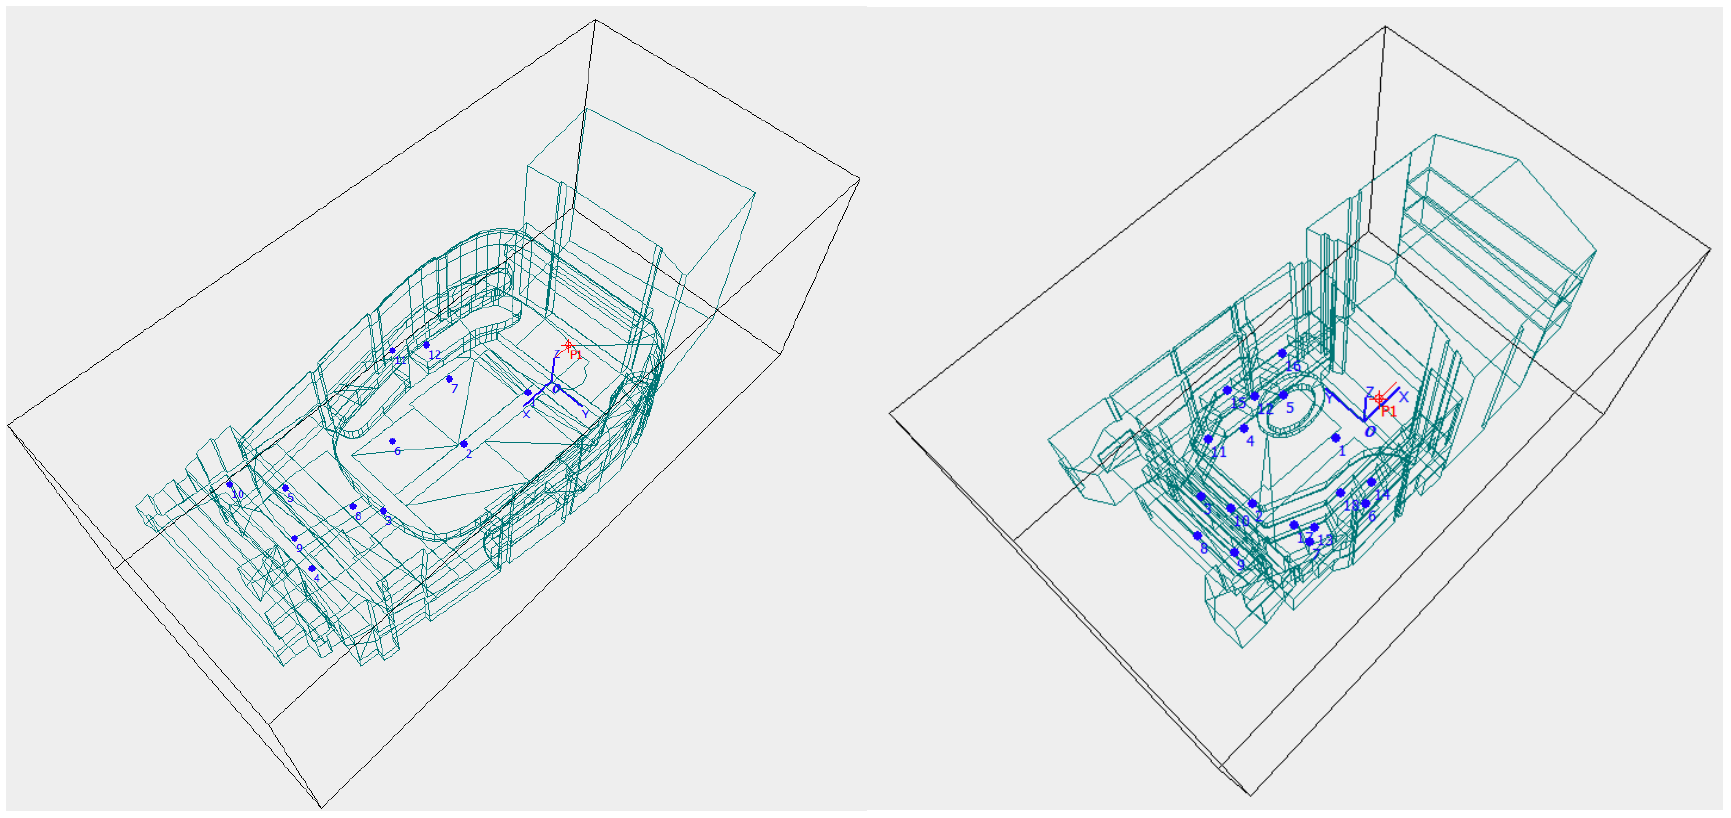
The method chosen to develop the study consists in the experimental field measurement of the acoustic parameters. The main point of the acoustic measurement is to study the most relevant points of the venue with what is called impulse response. An impulse response is able to characterize linear time invariant systems. Any receiving point in the room can be understood as a linear time invariant system. This characterization done by emitting a sine-sweep inside the room, a kind of sound signal that covers all the audible frequency range and measuring how that sound is affected by the intrinsic characteristics of the space. After analyzing that sound, we can not only obtain all the acoustic parameters of the room, but also, we are able to compute the way in which any sound would react in that space. In this specific study, the rooms analyzed were measured using first an omnidirectional microphone and then a bidirectional one. This allows us to define how the sound would be perceived by the auditory system and the influence of the side walls on the localization of the sounds (Sakamoto et al., 2008). The impulse response was recorded in various positions on the audience plane (Figure 6). Additionally, the field measurements were done in two different room conditions, with the curtain open and with the curtain undrawn. By measuring the room in those two different conditions it is possible to better understand the influence of the proscenium, These experimental measurements were conducted in accordance with the ISO 3382 (ISO 3382-1. Acoustics - Measurement of Room Acoustic Parameters - Part 1: Performance Spaces, 2009). The sound source used is a Bruel & Kjaer omnidirectional source. The microphone used to record the acoustic signal is a Shore KSM44A condenser microphone.
_and_the_tala_theater_(right).png)
An analytic survey was performed on both halls to gather acoustic and geometric data. By visiting the venues, we have collected information about the building materials, specially those that affect the acoustic behavior, and how they have been built. Some onsite measurements were done to complement the information collected prior to visiting the theaters.
The number of receivers set in each theater was conditioned by the configuration of each of the spaces: number of floors, the differentiation of spaces (stall, balconies, amphitheaters) and the lack of symmetry (due to that in the Talía Theater a larger number of receivers were set). The receiver points were distributed uniformly and non-symmetrical in relation to the room axis. Placing the measurement points in a non-symmetrical way is crucial to avoid the influence of eigenmodes. The source was placed in the center of the apron, which allowed us to maintain its position in the closed curtain measurement procedure.
To define the (x, y, z) coordinates of the source and receivers (Table 3 and Table 4), we have set the origin in the center of the apron at the lowest point, where it joins the stalls. The analysis was conducted without audience.
A series of acoustic parameters were obtained after computing the impulsive response, the early decay time EDT, the reverberation time RT30, the objective clarity C80, the definition D50, and the speech transmission index STI. These parameters are considered the most relevant when studying the acoustic behavior of theaters and music halls.
The Early Decay Time, EDT, is the time (in seconds) in which the first 10 dB fall of a decay curve multiplied by a factor of 6. The reverberation time of a room, RT30, is the time it takes for sound pressure level to decay by 30 dB multiplied by 2. In unoccupied halls, the EDT is also a way of measuring the reverberation time (Long, 2005). The EDT gives a more accurate representation of the subjective impression of the reverberation time than the RT30. The lower the EDT is compared to the RT30, the more intelligible the spoken voice is in that space (Arau-Puchades, 1999).
The Clarity of a room (C80) describes the relationship between early sound reflections and late sound reflections. In general, it is inversely proportional to the reverberation time (Beranek, 2004). A room would have a clear and precise sound when the clarity values are high. The Definition (D50) is the ratio of the early received sound energy to the total received energy. It is directly proportional to the Clarity. Both parameters are related to intelligibility.
The reverberation time in mid-frequencies (RT mid) is the average value of the RT30 at 500Hz and 1000Hz. The recommended RTmid for venues in which intelligibility is an important factor is between 1,2s to 1,5s, assuming the presence of an audience. Those values would differ with an empty room. (Carrión Isbert, 1998).
The Speech Transmission Index (STI) is an indicator of the intelligibility of a room. An STI between 0,50 and 0,64 would be considered adequate (Carrión Isbert, 1998).
Besides the already mentioned parameters, some other characteristics of the theaters were accounted for to complete the analysis. Those characteristics are the number of seats N, the volume of the room VR, the volume of the fly-tower VF, the acoustical audience area SA, the proscenium curtain area SP, the acoustical absorbent area ST (which is the sum of the prior two and refers to the amount of absorbent surface of the enclosure), the surface of the stage SS, the average height of the theater H, the average width of the space W, the average length of the room L, and the distance from the front of the stage to the most distant listener D.
The ratio between some relevant parameters was assessed to compare the influence of the architectural characteristics in both theaters. In the case of the volume of the room, it is interesting to take into account its ratio with the acoustical absorbent area (VR/ST), the volume of the fly-tower (VR/VF), and the number of seats (VR/N). In addition, the ratios between average height, width, and length have been calculated, H/W, L/W.
As mentioned in previous sections, the materials, the absorption coefficient of the enclosure surfaces, and almost every physical characteristic except volume are very similar in both cases. Therefore, the differences in acoustic behavior between the rooms seem to be due to the volume of each venue.
3. Results
The results obtained after processing the data acquired during the field measurements can be seen in Table 5. As it was mentioned in previous sections, the measurements were conducted both with the curtain opened and undrawn.
The correlation between EDT and RT30 (Table 5) is an indicator of the intelligibility of speech. The percentual difference between the EDT and the RT30 at mid frequencies in the Olympia Theater is about 11%. In the case of the Talía Theater, it is above 14%. These values do not differ very much between them, which indicates a good level of intelligibility.
As can be observed in Table 5, the Olympia Theatre has higher values of C80 and D50, which indicates a greater level of intelligibility and clarity than Talía Theater.
Given that the theaters were measured without the presence of an audience, the EDTmid and RTmid results observed in Table 6 would be higher with the seats occupied. The volume of the fly-tower seems not to influence the results of the reverberation time nor the early decay time in either theater. Between them, the Olympia Theater appears to have a very low mid-frequency reverberation time, which produces a subjective effect called “dead room”. It would be desirable to increase the reverberation time of the venue to avoid it. On the contrary, the Talía Theater has an adequate reverberation time. Despite it being near the upper limit, it is still at a point in which intelligibility is not affected.
A proper diffusion level is guaranteed when values of EDTmid are similar to those of RTmid. The ornamentation and irregularities of the surfaces contribute to an increase in the sound diffusion of a particular room. The ornamentation also adds a homogenizing effect to the reverberant sound (Beranek, 2004). In this case, the EDTmid is similar to its correspondent RTmid. For that reason, both theaters have a good diffusion level.
The STI of both theaters can be considered “Acceptable” (Table 7). Although the Olympia Theater is a bit more intelligible than the Talía Theater. This is consistent with the data of clarity and definition.
The physical parameters measured in each theatre are shown in Table 8.
The calculated ratios can be seen in Table 9.
In order to evaluate the magnitude of the similarity between the parametric data of both theaters, a Brainerd-Robinson (Brainerd, 1951; Jiménez-Puerto, 2018) analysis has been carried out. This analysis yields a percentage of similarity between the data packages involved. In this case, the percentage has been 85%, which validates our initial hypothesis regarding the choice of two very similar spaces.
The ratio between the volume of the room, VR, and the total absorbent area, ST, should satisfy the expression: RTmid=0,14(VR/ST) to ensure a good acoustic behavior in the room (Carrión Isbert, 1998). Table 9 indicates that since both theaters share the VR/ST proportion, this ratio would be 1,21; which compared to the values of RTmid in Table 6 shows that both Olympia and Talía theaters are more or less equally distant from the target (between a 14 % and 17% of variation) and within an acceptable distance.
4. Conclusions
The design of venues, and other spaces with live acoustic performances, requires keeping in mind acoustic, structural, and design aspects. These aspects that sometimes seem to be isolated from each other, are closely interrelated. With this work, we wanted to investigate how some of these relations could affect the performance of a specific room.
In the case study, it was interesting to observe and study why despite the theaters sharing all its physical characteristics, except one, and many of its absorbent characteristics, the acoustic measurement gave slightly different results. The main goal, therefore, was to dive into the possible causes of those differences.
The Olympia Theatre doubles in size the volume of the main room of the Talía Theater and almost triples it in capacity. That explains why the VR/VF ratio is directly proportional, while the ratio between VR/N is inversely proportional. The acoustical absorbent area, ST, is double in the Olympia Theater, but the volume of the room vs the acoustical absorbent area, VR/ST is equal. That means that both spaces have the same percentage of absorbent surfaces proportional to each volume. If only the amount of absorbent areas were enough to determine the acoustical behavior of a room, the different acoustic parameters we have studied would be very similar for both rooms. However, the proportions of both theaters do differ quite a bit. In the Olympia Theater, the length of the room predominates over the rest of the dimensions, width, and height, even the width is significantly larger than the height. The Talía Theater is practically cubic (height, width, and height are similar).
As we have seen prior, the acoustic parameters EDT, RT30, C80, take higher values in the Talía Theater. Meanwhile, the D50 is very similar in both of them. Also, the study of the acoustic data reveals that acoustic parameters are being affected very slightly by the opened-undrawn curtain measurement set, which means that the contribution to sound absorption of the fly-tower is balanced. In addition, the similarity in the ratio VR/ST, related to the field measurements could be an indicator of the independence of the size of the fly-tower in the final acoustic behavior of the room, which was an unexpected result and will need further analysis. For example, adding more diverse cases to the study in order to reach a relevant conclusion.
The acoustic behavior is not determined unambiguously by the volume of the room and the total absorbent area but can be affected by the interrelation of the different dimensions that configure the space.
Both buildings share the same materials, but further analysis of the way the materials of the surfaces are placed would be necessary. It would also be recommendable to make a virtual acoustic model and adjust them, to evaluate the contribution of this aspect in the behavior of the room.
The results of this study emphasize the importance of proportions and building details and diminish the relevance of the amount of absorbent square meters in the design of spaces where acoustic comfort is essential.
To complete the survey, an on-site acoustic measurement with an audience would be desirable, to test the theatre in the standard use conditions.