


1. Introduction
Since the late twentieth century, metropolitan areas have experienced a key economic shift because of mass deindustrialization and consolidation of services. In this new scenario, the so-called knowledge-based industries (hereinafter KBI) emerged as the main drivers of that process (Harris, 2001).
The earlier works of Romer (1990) and Lucas (1988) claim that knowledge and innovation tend to be highly localized, thereby conferring an increasing value on human capital and urban agglomeration as factors that encourage economic growth. This leads to the creation of knowledge spillovers in specific areas that encourage the generation of buzz environments, which boost cross-fertilization among specialized and diverse networks through face-to-face contacts (Storper & Venables, 2004), even temporary spatial proximity to develop processes of interpersonal trust (Growe, 2019).
Furthermore, network externalities, which are created by long-range non-hierarchical interactions between territories, encourage KBI’ firms’ agglomeration in central areas of large cities with deeply embedded innovations processes (Taylor et al., 2010). All those processes supported by a social capital, which involves shared codes of behaviour facilitating knowledge transfers (Lambooy, 2010). However, it remains unclear how the spatial clustering of KBI and other industries are related and what role functional inter-industry linkages, both forward and backward, have in this process.
The research paper hypothesis suggests that, despite high specialization of KBI and their integration into global networks, these industries have functional linkages in regional markets, thus affecting the dynamics of employment growth as a whole. These processes studied in Catalonia, in which Barcelona Metropolitan Region (BMR) is the largest urban agglomeration. To achieve this, this paper studies with the use of Proxcal Multidimensional Scaling (MDS) analysis, the relationship between the technical coefficients’ matrix of Catalonia’s input-output (I-O), which show economic interdependences among all industries, and a geographic interdependences’ matrix that is calculated with municipal employment data and intercity distances. This matrix summarizes in one single value the average physical distances between total employments by industry, which are located in many municipalities. Furthermore, the MDS analysis enables to reduce the original proximity measures of both economic and geographic interdependences matrices to Euclidean distances that represent new proximity measures, which are visualized in a Cartesian plane. Hence, the position of each industry in the two resulting Proxscal MDS spaces is a synthesis of its functional dynamics and spatial location relating to all the industries of Catalonia. In that sense, this paper highlights the use of innovative data-driven approach to analyse KBI’ employment growth processes and their clustering patterns in the metropolitan arena.
After this introduction, the next section reviews briefly the literature in which location theory is based; then follows an overview of data and methods used; the results presented next, a final section summarizes conclusions and recommendations to public policies related.
2. KBI’s Location Factors
The three main theoretical approaches used here to explain the location of KBI are: 1) inter-industry linkages, which in the case of KBI are also related to knowledge exchanges; 2) agglomeration and network externalities, which explain the benefits that firms gain by locating close to each other in specialized cluster or in central areas of large cities that are increasingly networks’ nodes through which intense flows of knowledge pass; and 3) human and social capitals, which encourage successful business relationships for innovation.
Firstly, Hirschman’s concept of inter-industry linkages states that firms create backward and forward linkages in their investment decisions, which establish cross-industry ties with spatial effects. Hirschman (1958) argues that economic growth boosted by the increasing growth of industries with multiple economic interrelations. Perroux’s (1955) theory of development poles also refers to inter-industry linkages as a mechanism for economic growth. Contemporary, these interactions that arise between firms are mainly related to knowledge exchanges, that local and international collaboration promote, especially in KBI’ firms as Fitjar & Rodríguez‐Pose (2020) study in Norway.
Furthermore, the regional policy literature has shown a renewed interest in the promotion of industries with the potential to embed themselves into regional economies. In that sense, the input-output (I-O) tables have been broadly used as a tool in regional development analyses by different authors. Hauknes & Knell (2009) utilize I-O tables, in various countries to analyse knowledge flows in industrial production; Hwang & Lee (2014) employ I-O tables in Korea to analyse knowledge spillovers creation.
Secondly, external economies, both agglomeration and network externalities, are well-known as other factors that determine the location of economic activities. This concept introduced by the economist A. Marshall (1920), to explain industrial concentration, which leads to a reduction of production costs and to an increase in productivity. In the Marshall industrial district, local networks producing the so-called external economies (Becattini et al., 2009). Of the set of external economies, knowledge spillovers have a prominent role in the clustering of KBI (Aslesen & Isaksen, 2007). These are exchanges of non-traded knowledge, which are massively important for firms because, from a firm’s perspective, knowledge production is a private good (Boschma, 2005). Hence, knowledge spillovers are often localized, which means that local conditions play a critical role in the emergence and dissemination of many kinds of knowledge; for this reason, firms often seek locations close to universities (Lehmann et al., 2020) or in densely populated cities with high cultural diversity where interactions with other firms and access to a wide range of network externalities happens (Audretsch et al., 2021). Additionally, internet facilities found in large cities enable telepresence meetings to replicate face-to-face meetings as an effective way of interfirm or interorganisational collaboration (Martin et al., 2018).
Thirdly, human and social capitals become considered influential factors in attracting and retaining KBI’ employment (Van Oort et al., 2009). Even nowadays digital social capital that is supported by online social networks support, encourages KBI’ employment growth because it facilitates knowledge spillovers creation between dislocated actors (Tranos, 2016).
In short, in addition to classical requirements for economic growth such as transport and communication infrastructures; nowadays, skills, socio-cultural diversity, and health and environmental conditions also conceived as influential factors (Kourtit & Nijkamp, 2016). Additionally, in terms of the direct benefits of agglomeration (functional links) and indirect benefits (externalities), interaction among firms should be related to their spatial distribution, following Porter’s cluster theory (Porter, 1998). However, it is not entirely clear related to KBI how spatial clustering encourages functional interrelations within them, and conversely, how functional dynamics encourage spatial clustering of those and other interlinked industries. In that sense, this paper offers empirical evidence from Catalonia regarding these processes.
3. Methodology and Data
3.1 Data
Employment data for 1991-2001 at two-digits of the EU’s statistical classification of economic activities (NACE Rev.1.1) is used.[1] This comes from the population census elaborated by the Statistical Institute of Spain (INE for its acronym in Spanish). This intercensal period is a key period to understand the big shift in Catalonian labour market figures, specially KBI’ employment. In addition, other data include technical coefficients’ matrix (this represents the overall economic interdependences among all industries located in Catalonia), which is part of the Catalonian input-output (I-O) table of 2001 and intercity distances that come from an own analysis.
3.2 Methodological Stages
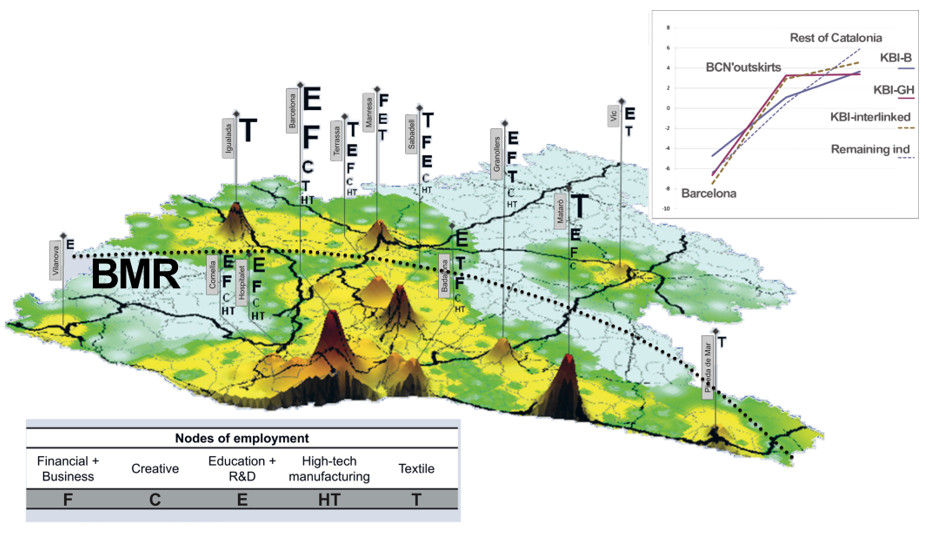
The methodology comprises two stages. In stage one, KBI are defined according to workers’ educational level by industry, highlighting the industries that employ qualified workers. Furthermore, KBI are categorized according to their main consumption orientation, isolating those that are business-orientated from those that are government and households orientated. KBI consumption orientation could determine different location patterns and distinct employment growing dynamics. Additionally, the main KBI’ economic interlinked industries, both suppliers (backward linkages, hereinafter KBI-iBLINK) and buyers (forward linkages, hereinafter KBI-iFLINK) are identified. In stage two, the relationship between employment location and functional interlinkages of KBI and their interlinked industries, due to input-output relationships analysed.
3.2.1. Definition of knowledge-based industries (KBI) and the KBI’ interlinked industries
The industries studied are those identified by the Organization for Economic Co-operation and Development (OCDE, 2001) as high-tech manufacturing and knowledge-intensive services (ICT, research and development R&D, finance, business services, health, and education); cultural–creative also included, using the EUROSTAT classification. This classification validated by a multivariate analysis (Principal components factor analysis-PCA and hierarchical cluster analysis) built based on workers’ educational level by industry according to data that comes from INE of 2001. PCA reveals relationships between employment variables by identifying new and uncorrelated variables (factors), which contain those relationships patterns. Cluster analysis reveals homogenous groups (clusters) of industries, using PCA factors. Furthermore, KBI’ employment categorized according to their main consumption orientation. In doing so, a cluster analysis made with data about consumption orientation by industry from Catalonia’s I-O table. Two main categories of KBI at two digits of NACE Rev 1.1 were identified, as follows: government and household-orientated consumption (hereinafter KBI-GH) that correspond to five (5) industries; and business-orientated consumption (hereinafter KBI-B) that correspond to nine (9) industries. In addition, in this latter category two sub-categories were identified: local business-orientated (hereinafter KBI-LB) and export business-orientated (hereinafter KBI-ExB). Table 1 illustrates this classification.

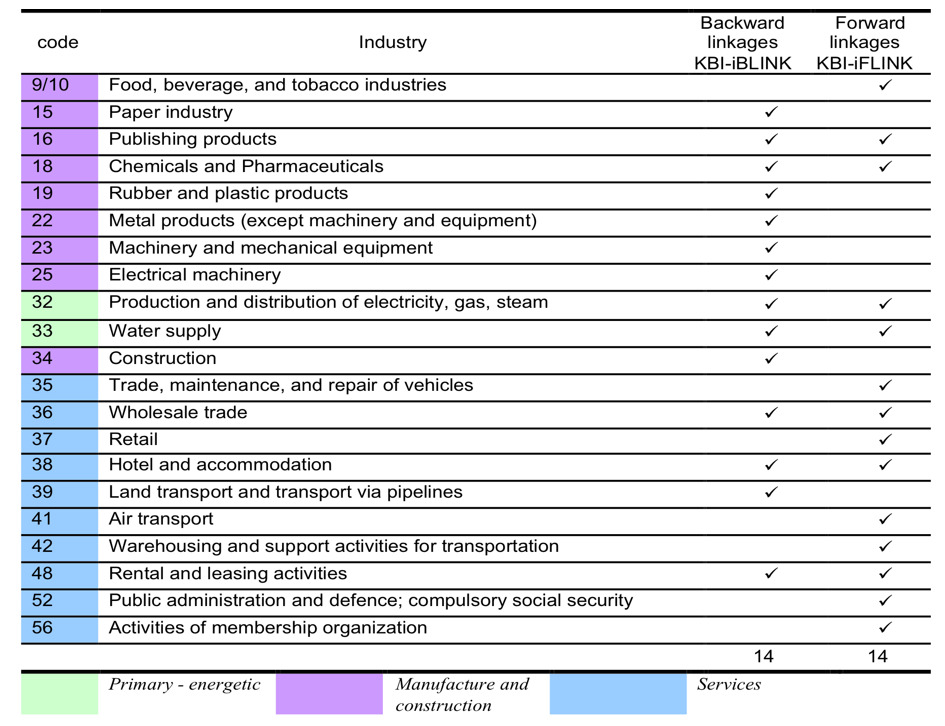
Additionally, to identify the main KBI’ interlinked industries, both industries with high sales to KBI (KBI-iBLINK) and industries with high purchases to KBI (KBI-iFLINK) it is used the technical coefficients of Catalonia’s I-O table of 2001 and after performing a cluster analysis, homogenous groups of industries in terms of KBI functional linkages found. Table 2 illustrates this classification.
3.2.2 Functional and formal positioning of KBI in two Cartesian planes (methodology stage two)
The technical coefficients of Catalonia’s I-O table used to identify functional inter-industry linkages between all industries, including KBI. In addition, equation (1) is calculated to build a geographical distances’ matrix of regional employment by industry. In other words, this matrix summarizes in one single value the average distances at which employment in each industry regarding remaining industries are, considering municipal employment structure and inter-municipal physical distances by road.
Dgij=∑946x,y=1empix∗empiy∗dxy∑946x,y=1Pix∗Piy
In (1) Dg is the geographical distance between two given industries i and j; x and y are municipalities; emp are the municipal employment in 2001; and d is the intercity distances by road. This geographical distance’s (Dg) advantages are: 1) It is a strong measure regarding the size of municipalities in terms of employment; 2) It is a solid measure concerning size differences between industries; and 3) It summarizes in one single value the average physical distances between total employments by industry, which are located in many municipalities.
The resulting matrices are n-dimensional. Therefore, to visualize both matrices in a low-dimensional space, Proxscal Multidimensional Scaling (MDS)[2] is used. This technique enables to reduce the original measures of proximity (that is functional inter-industry linkages and geographic distances between all industries) to Euclidean distances that represent new proximity measures obtained in a Cartesian plane. Hence, the position of each industry in the two resulting Proxscal spaces is a synthesis of its functional dynamics and spatial location relating to all the industries of Catalonia. In other words, the Functional Proxscal space (hereinafter F-Proxscal) shows the functional interlinkages that exist between all industries; and the Spatial Proxscal space (hereinafter S-Proxscal) shows the relative geographic distances that exist between employment locations by industry in Catalonia. Furthermore, the spatial correlation between these two Proxscal spaces using the Pearson correlation index reveals functional and employment industrial location links; this is observed for all industries and for KBI individually.
4. Results
4.1 Barcelona Metropolitan Region (BMR) as Case Study
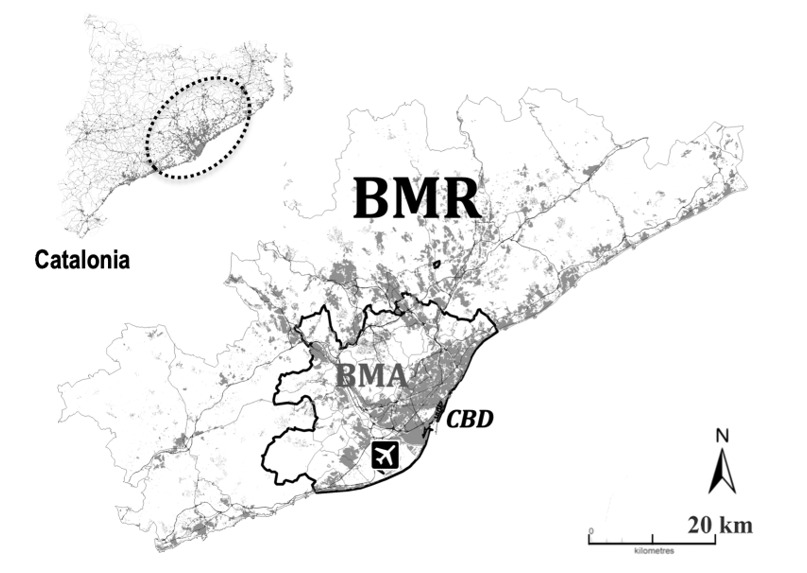
According to the Statistical Institute of Catalonia (IDESCAT for its acronym in Catalan), in 2020 the BMR was 4.96 million inhabitants, 65% of total Catalonian population; these figures was a slightly higher in 2001 when the BMR corresponded to 67% of Catalan population, showing a population scattering process from the BMR to the rest of the region. Catalonia corresponds to a NUTS-2 in the EU’s Nomenclature of Territorial Units for Statistics (NUTS). Figure 1 illustrates location and urban situation of the BMR in Catalonia.
Additionally, according to the Labour Force Survey from 2019 elaborated by IDESCAT, the BMR has 2.42 million jobs, which corresponds to the 70% of total Catalonian employment. Historically, the BMR has concentrated the mayor employment figures of Catalonia, also in KBI’ employment. However, in the period 1991-2001 overall employment decentralization figures from the BMR to the rest of Catalonia already show a positive tendency; although this process is minor in KBI’ employment, which reveals an inertial tendency to be located close to the metropolitan core. In the period there was a deeply negative increment of KBI’ employment concentration in the metropolitan core and the subcentres of 5.7 points; meanwhile in the urban agglomeration’s outskirts there was a positive increment of 2.2 points, and in the rest of Catalonia of 3.5 points (Figure 2).
_at_the_bmr.png)
4.2 The Knowledge-based industries (KBI) and their interlinked industries
According to Catalonia Gross Valued Added (GVA) from IDESCAT, in 2018, KBI represented around 36% of total regional production; meanwhile in 2001 it was 34%, which shows KBI solid value at the regional economy figures. Additionally, in 2018 the BMR represented around 79% of the total KBI’ GVA from Catalonia.
Furthermore, the KBI local business-orientated (KBI-LB) employ 47% of total KBI’ employment in Catalonia. Additionally, most of the KBI-LB are sectors with an extensive demand from other industries local and export-orientated, suggesting that productivity and competitiveness of the whole Catalonian economy may be influenced by the activity of KBI. In this regard, the analyses reveal that KBI have intensive and diverse forward linkages than backward linkages with other industries. Thus, in the region, 35% of overall purchases and 56% of overall sales of KBI are with other industries non-KBI. This means that more than half of Catalonian industries are dependent on KBI production. This behaviour is not identical for all KBI. Thus, business services, real estate, finance, and IT are the KBI with the largest sales rates to non-KBI, whereas business services, high-tech manufacturing, real estate, and creative industries are the largest KBI’providers to non-KBI.
In short, Catalonian overall employment growth can be positively affected by KBI’ employment dynamics, especially employment growth in industries highly related to them. Hence, from the urban growth perspective, it is also important to identify if functional dynamics boost spatial proximity of employment. In the next paragraph, these issues discussed.
4.3 The KBI’ functional and spatial clustering dynamics
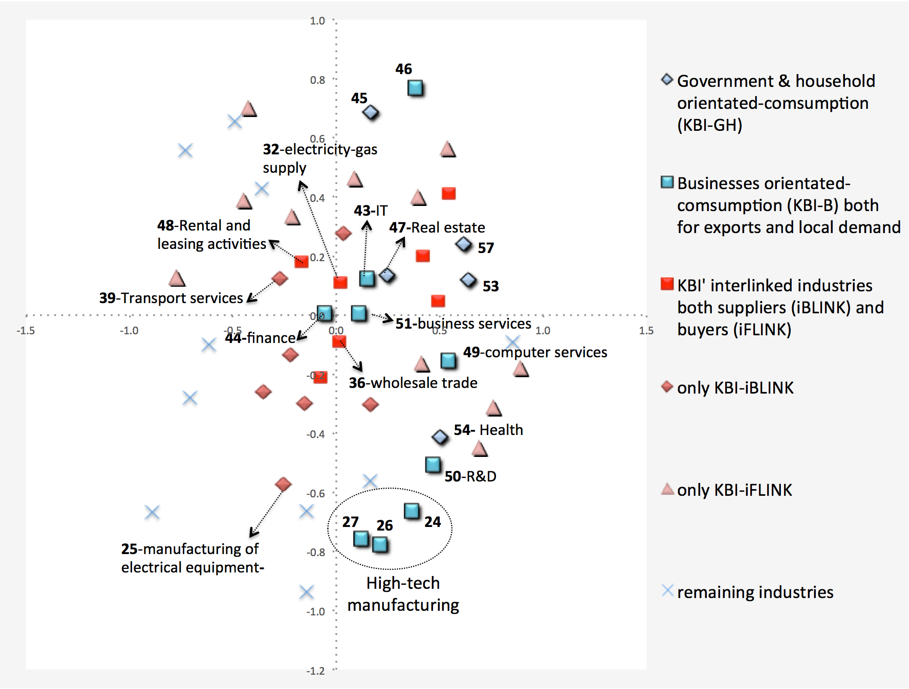
The distribution of each industry in the Proxscal MDS spaces should be interpreted in different ways. On the one hand, short distances in the Functional Proxscal space (F-Proxscal) suggest intense industrial relationships. Moreover, industries located close to the gravity centre (coordinates 0,0) means industries that have central values in the entire Catalonian economy, either because they enjoy high demand from other industries or because they are large suppliers to other industries. On the other hand, short distances in the Spatial Proxscal space (S-Proxscal) indicate proximity in the spatial clustering of employment. Furthermore, industries located close to the gravity centre (coordinates 0,0) means industries mainly located in the largest urban agglomerations of the region.
4.3.1. KBI’s functional dynamics
Results of this analysis suggest that KBI are at the heart of economic relationships of the entire Catalan economy. Generally speaking, the distance of KBI to the F-Proxscal centre (core of economic inter-industry linkages) is 0.55 Proxscal units, while in the other industries it is 0.62 Proxscal units; therefore, it could be said that KBI are nearer the epicentre of economic relations than other industries are. However, KBI have heterogeneous functional relationships with other industries due to their varied consumption orientation. Hence, local business-orientated KBI-LB appear located closer (0.38 Proxscal units) to the economic epicentre of the Catalonian economy than other KBI types, which reveals that those KBI have the most extensive functional interlinkages with other industries. It is worth noting that all KBI-LB, finance, businesses, and IT services are closer to the epicentre of the F-Proxscal (0.12 Proxscal units). Moreover, export business-orientated KBI-ExB have low functional interlinkages with other industries; this is confirmed by their peripheral position in the F-Proxscal (0.72 Proxscal units from the centre). This fact could be interpreted as meaning that KBI-ExB demand inputs beyond the Catalonian industrial environment. Furthermore, government and household-orientated KBI-GH are found in an intermediate position between the remaining KBI types; these are 0.59 Proxscal units from the F-Proxscal centre. In that sense, the position of KBI-GH follows logical location patterns, since besides the BMR, other medium-size cities in Catalonia have a large demand for these industries. Furthermore, the analysis also reveals that KBI have more intensive functional interlinkages among themselves. In this sense, the average Proxscal distance between KBI is 0.63 Proxscal units, whereas between KBI and non-KBI it is 0.86 Proxscal units.
Figure 3 illustrates the position of all industries in the F-Proxscal, distinguishing KBI types according to the main consumption orientation; KBI’ interlinked industries both KBI-iBLINK and KBI-iFLINK, and remaining industries. As mentioned above, mainly KBI-LB are at the centre of economic relationships in Catalonia, specifically, IT services (43), finance (44) and business services (51), which means that these KBI have the most intense functional dynamics at the whole Catalonian labour market. Together with those KBI are real estate (47) from KBI-GH group. In contrast, KBI-ExB that include high-tech manufacturing (24, 26 and 27) as well as KBI-LB computer services (49) and R&D (50), and KBI’ interlinked industry manufacturing of electrical equipment (25) have peripheral positions in the F-Proxcal. This fact suggests the existence of specialized functional linkages among all these industries and few economic interlinkages with other industries in the region.

In short, the centrality of KBI in the Catalonian economic structure is an indicator of its transition from a manufacturing-based economy towards a service-based economy, especially in KBI. As a result, the Shannon’s diversity index,[3] which is used here to measure the complexity level of functional interlinkages between all industries, reveals that KBI have larger diversity values in interindustry linkages (2.64) than remaining industries (2.36) are at the region. Furthermore, when isolating KBI, the diversity index of KBI interindustry linkages is larger for their sales (2.94) than for their purchases (2.34), which highlights the role of KBI in other industries’ demand, specially of those local business-orientated KBI-LB.
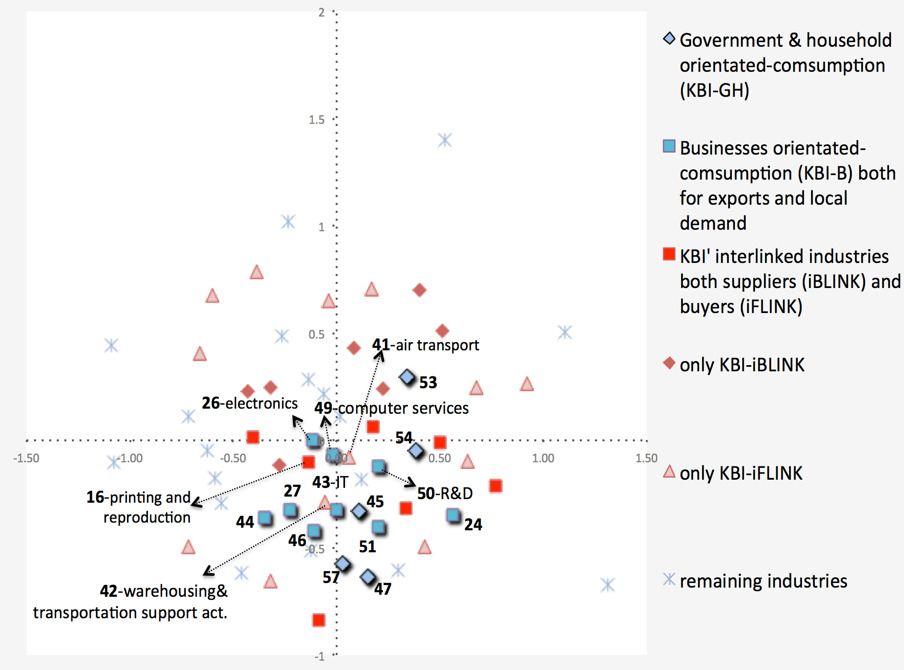
The centrality of KBI’ employment is also spatial. This is revealed by the central position of KBI in the S-Proxscal, which means that KBI’ employment tends to be clustered in the largest Catalonian cities (Figure 4). Globally, the distance of KBI employment from the S-Proxscal centre (coordinates 0,0), which corresponds to the regional core of employment agglomeration in Catalonia, that is the BMR, is 0.40 Proxscal units; meanwhile the remaining industries are from 0.65 Proxscal units. Of all KBI, export business-orientated KBI-ExB have the shortest distances to the S-Proxscal centre (0.31 Proxscal units), which means highly clustered employment in these industries, specially at the BMR. This fact underlines the significant values found in the BMR for location of KBI’ employment such as the international airport, the trade port, and fast train connections as well as amenities, large pools of skilled workers and innovativeness. Other local businesses-orientated KBI-LB and government and household-orientated KBI-GH are in intermediate positions of the S-Proxscal, but close to its centre, they are from 0.39 and 0.48 Proxscal units, respectively. As it was mentioned above, in Catalonia unlike what happens with the overall industries’ employment, KBI’ employment shows an inertial tendency to be located close to the metropolitan core following urban location patterns. More specifically, the analysis of the position of each industry in the S-Proxscal reveals that business-orientated KBI-B such as the manufacturing of electronics (26), computer services (49), IT services (43), and R&D (50) tend to be located close to the epicentre of S-Proxscal, that is in the BMR. In addition, some KBI’ interlinked industries such as printing and the reproduction of recorded media (16), warehousing and transport support activities (42) and air transport (41) also have central clustering patterns. Therefore, it could be said that business-orientated KBI-B are physically closer to overall industries’ employment than the other KBI are, this is revealed by their central spatial patterns in the S-Proxscal.
Furthermore, analysis also reveals that KBI’ employment tends to be located spatially closer among themselves (0.42 Proxscal units) than remaining industries are (0.89 Proxscal units).
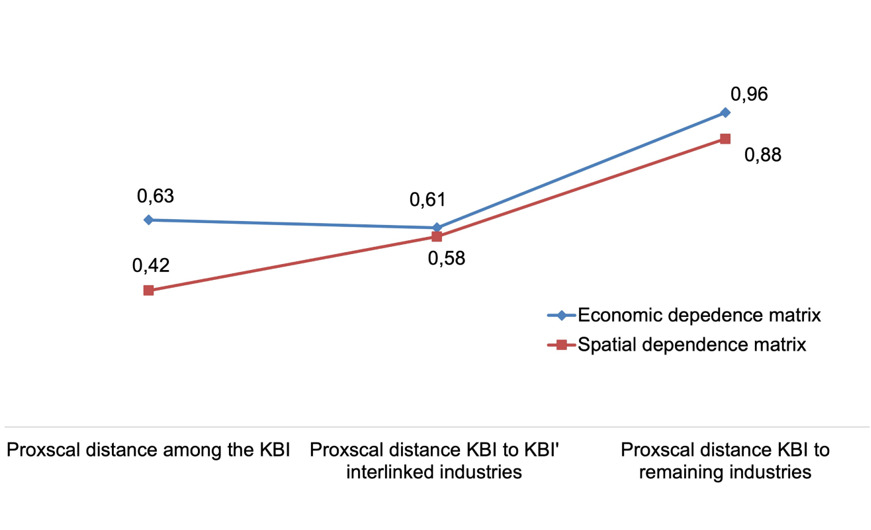
Finally, the comparison of the average distances of all industries in both functional and spatial Proxscal spaces is made. In this analysis, low values in both F-Proxscal space reveal intense functional dynamics, and in S-Proxscal space reveal close spatial clustering of employment. In Figure 5, the average distance of F-Proxscal of all the KBI is 0.63 F-Proxscal units, which suggests intense interlinkages among them, but it seems this does not encourage spatial proximity clustering, since the average distance of S-Proxscal is 0.42 S-Proxscal units. This is due to while government and household-orientated KBI-GH follow population patterns distribution, meanwhile business-orientated KBI-B have special attraction for central locations where network and agglomeration economies are located. Furthermore, the average distances of both functional and spatial Proxscal spaces between KBI and remaining industries’ employment are the highest at the whole Catalonian economy, which means poor economic interlinkages and weak clustering patterns among them.
However, a more profound analysis of correlation in position of each industry in both Proxscal spaces could offer more evidence to understand the main issues of the research question of this paper, that is how KBI spatial clustering encourages functional interrelations within them, and conversely, how functional dynamics encourage spatial clustering of those and other interlinked industries. In the next paragraph, this issue is discussed.
4.4 Correlation between Spatial Clustering and Functional Dynamics of KBI
Correlation of the coordinates (x, y) of the two Proxscal matrices using the Pearson correlation index[4] is done. The results reveal a poor correlation r=0.21 for all industries. However, if only the spatial and functional coordinates of KBI are correlated, this value slightly increases to r=0.23. Yet, as has been argued, KBI’ employment has a high level of heterogeneity; hence if only business-orientated KB-BI, both local and export-orientated consumption are considered, the correlation between both matrices increases significantly up to r=0.51. However, the correlation indexes between the Proxscal matrices of KBI and their interlinked industries reveal a low correlation r=0.07 for supplier industries and r=0.32 for buyer industries. In that sense, it could be said that the increasing correlations between KBI’ Proxscal matrices seem to confirm the idea about the importance of physical proximity in KBI’ employment spatial clustering. Moreover, KBI’ input-output relationships with other industries do not appear to be a determining factor for a closer spatial clustering among these industries. Some arguments in this regard are as follows:
-
Local business-orientated KBI-LB are strongly linked to whole regional industrial environments; therefore, they have more central patterns in their functional dynamics than in the spatial employment clustering.
-
Export business-orientated KBI-ExB show peripheral patterns in both F-Proxscal and S-Proxscal. This is due to the fact these KBI also have long-range interactions at the regional market.
-
Government and household-orientated KBI-GH show intermediate patterns between the other KBI groups.Iit is worth noting that spatial clustering of these is the result of public policies and demographic distributions.
5. Conclusions
There is a certain consensus in the related literature about the role of knowledge spillovers as well as of social and human capital in spatial clustering of KBI’ employment. Face-to-face contacts, which emphasize the importance of physical proximity to develop processes of interpersonal trust for knowledge and innovation production, and network economies derived from externalities created by long-distance interactions between innovative players, emerge as decisive mechanisms for KBI’ employment growth. Furthermore, Hirschman’s concept about industrial interlinkages both backward and forward states that these links have spatial effects on firms’ location.
This paper offers empirical evidence from Catalonia, where Barcelona Metropolitan Region (BMR) is the largest urban agglomeration, of functional dynamics’ effects of the knowledge-based industries (KBI) both business-orientated KBI-B and government and household-orientated KBI-GH on spatial clustering of those and other interlinked industries. Complementary, this paper presents a solid data-driven approach, contributing by this way to discussions about implications of data in quantitative urban analyses. In that sense, an innovative approach to the Multidimensional Scale Analysis is made. In this paper, this technique is used in order to relate an economic dependency matrix, which explains the relationship between all the economic sectors including the KBI, with a spatial dependency matrix, which shows the relative geographic distances that exist between employment locations of KBI and remaining industries in Catalonia.
Results reveal that KBI, especially those business-orientated, have large functional interlinkages with each other and tend to be clustered close together, especially in metropolitan Barcelona. In fact, KBI’ employment decentralization processes reveal a distinctly inertial tendency to move to the Barcelona’s outskirts. This fact confirms the importance of face-to-face contacts that central areas promote, even for temporary spatial proximity, as well as economic diversity, and accessibility to a wide range of network externalities found in those areas as transport infrastructures and fast internet connections. Furthermore, expectations regarding the spatial close dependence of those KBI’ interlinked industries with KBI are no clear. It means that input and output relationships of KBI do not require of spatial proximity, and those functional linkages occur in large and diverse regional employment markets.
At length, the results of this study have important implications for urban planning policies. The results suggest that for many KBI, especially those business-orientated, encouraging land uses for diverse economic activities may be a more appropriate policy option at the regional level, since for KBI’ firms it is not sufficient to be specialized, it is also important to be connected with similar and complementary industries. Furthermore, an informed policy regarding KBI’ employment clustering in metropolitan areas needs to consider their preference for central and well-interconnected locations where both physical and virtual interactions are more affordable.
This study takes the NACE Rev 1.1 as statistical economic classification of reference.
Multidimensional Scaling (MDS) Proxscal has been already used in economic and geographic works (Burns et al., 2008).
The diversity index of Shannon is calculated as follows:
Hy=−1∗59∑x=1Pxy∗Ln(Pxy)H is the diversity of functional interlinkages of industry y with the rest of industries; and Pxy is the probability of consumption that makes the industry x from y. In this case, the highest diversity index’s values mean high diversity patterns in functional interlinkages.
The Pearson index is a measure of linear correlation between two data sets. It has a value between -1 and 1. The sign of the index means positive or negative correlation.