1. Introduction
This paper discusses the methodology used in the study of morphological changes of buildings and plots in the Cité Ouvrière in Mulhouse in eastern France. Cité Ouvrière is a nineteenth century working-class settlement originally built for the workers of the DMC textile factory. It comprises of 1,253 single-family houses, which over the course of 165 years, have been transformed. The inhabitants have incrementally expanded their houses, altered their roofs and facades, added sheds, garages, shops, and workshops, and rented out parts of them for income (Kostourou, 2020b). The whole scheme has changed from a designed industrial housing development to domestic vernacular based on an extensive system of bottom-up and top-down adaptations and greater socio-economic changes.
In the process of studying Cité’s transformation, the main challenge was how to map the physical changes both synchronically and diachronically in order to measure them both individually as well as aggregately as a phenomenon of a larger neighbourhood. The two temporal dimensions mentioned, synchronic and diachronic, derive from the concept of ‘description retrieval’ in space syntax theory (Hillier & Hanson, 1984), according to which at any given time and for any given description of space, there are both synchronic and diachronic relations, that can be captured in a single frame or over time respectively (Griffiths, 2009; Hanson, 1989). In other words, apart from a static way of looking at the built environment, there is also a fundamental need to trace its description as a sequence in time because it assists the understanding of historicity (Griffiths, 2011) and of processes of growth and change in societies (Connerton, 1989), cities (Moudon, 1986; Psarra, 2018), and buildings (Brand, 1994; Steadman, 2008, 2014). Hence, mapping both the synchronic and diachronic descriptions of space in this study would provide a more thorough, systematic, and multi-scalar understanding of the capacity of different elements of the built environment to change with time.
In what follows, I present all the analytical steps and decisions taken to map changes in volume and shape at both an architectural and an urban scale, ultimately proposing a methodological workflow that joins historical research, spatial analytics, and architectural modelling (section 4). A first part discusses the availability and comparability of existing datasets (geographical, historical, and archival), exposing their current shortcomings (section 3). The next parts discuss quantitative and qualitative data separately. First, section 5 describes the creation of a synchronic 3D model based on available GIS data and historical drawings and images, and then, section 6 explains the collection and handling of categorical data from field surveys and historical building permits found in the municipal archives by means of visual observation, sampling, content review, and analysis. The last part explores the preparation, transformation, and combination of the datasets produced in the previous steps to create an original and comprehensive geospatial dataset that carries spatio-temporal attributes and features vector and three-dimensional forms, and which can be used to trace the evolution of the built form over time (section 7).
The paper proposes a new methodological workflow to collect and combine larger- and smaller-scale information from available online sources, archival research, and field survey whilst turning them comparable in terms of their level of detail, georeferencing and processing ability with the help of advanced analytical tools. This approach overcomes limitations of previous studies and helps researchers in the fields of urban studies, historical geography, cartography, and architecture to document past and present development patterns, visualise the dynamics of growth in the built environment, and predict future trends. It is also particularly useful for architects, planners, and data scientists who work with two- and three-dimensional data for the analysis of the built form.
2. The Field of Urban Morphology
Urban morphology is the field that investigates the formal elements of streets, buildings, and plots. In its classical form, there are several schools of thought: the Italian (process typological), the British (historic-geographical), the French (historiographical), the German (morphogenesis) and the North American (geographical). I will make no attempt here to explain the ideas and lines of inquiry behind each school, on the one side because excellent summaries have already been provided by Cataldi (2003), Marzot (2002), Whitehand (2001), Larkham (2006), Darin (1998), Hofmeister (2004) and Conzen (2001), and on the other, because a number of papers (e.g., Gauthier & Gilliland, 2006; Kropf, 2009; Moudon, 1997; Pinho & Oliveira, 2009; Scheer, 2015 to name a few) have already discussed the differences between them. What is of interest here though is that although the schools’ approaches seem to be fragmented and lack a coherent universal systematisation (Fleischmann, 2017), they share an epistemological overlap. This is concisely summarised by Scheer (2015, p. 3): “Epistemologically, all the urban morphology schools of thought share certain methods of acquiring knowledge, analysing it, and validating it. These are (1) collection of formal data about the study area; (2) recognition of common patterns in the study area and across study areas; (3) developing and testing theories of change; and (4) linking the results of the physical analysis to conditions not directly related to urban form”.
2.1. Existing Methods
In this common epistemological inquiry, there are two important caveats to note; the first refers to the type, extent, and resolution of formal data, and the second to the methods used for recognising patterns. On the one hand, classical morphologists gather data from historical maps, surveys, field measurements, photographs, and documentary records in a rather laborious and time-consuming way. Even though the produced datasets are very detailed and provide a fine-grained understanding of the ground conditions (see for example some of the earliest works of Muratori, 1959, M. R. G. Conzen, 1960 and Whitehand et al., 1999), they are limited in volume and extent—a problem often identified when dealing with small-scale data. On the other hand, analysts rely heavily on visual observations and verbal descriptions to recognise patterns from the gathered data; an approach which lacks systematisation and quantification, and depends on the resolution of the study and its context (Whitehand, 2012). Indeed, Serra (2013) flags this is a common and important problem in the classical field and calls evidence that stems from visual observation ill-defined, non-reproducible, and impossible to falsify.
After the 1970s, technological developments in the field of GIS and the availability of larger volumes of geospatial data made it possible to overcome some of these limitations. This saw the rise of quantitative urban morphology, which allowed for the cartographic representation of wider areas in the urban fabric and the analysis of the topological, dimensional, and geometrical relations of their formal elements at a larger scale (Erin et al., 2017). Few of the most distinctive methodological advancements include the mathematical models introduced by Martin & March (1972); the graph theories of Krüger (1977) and Steadman (1983); the Space Syntax theory and methods by Hillier & Hanson (1984); the Shape Grammar by Stiny (1980); the fractal geometries by Batty & Longley (1994); the Spacematrix density model by Berghauser Pont & Haupt (2004); the street patterns descriptor by Marshall (2005); the Multiple Centrality Assessment by Porta et al (2006); the architectural morphospace by Steadman & Mitchell (2010); and the Urban Network Analysis by Sevtsuk & Mekonnen (2012). However, these approaches have so far focused more on the analysis of spatial datasets rather than the creation of new ones, that may combine the resolution of small-scale data and the volume of larger-scale data.
3. Types of Data
In the present study, to measure morphological changes via one of the abovementioned tools of quantitative urban morphology, new spatial data had to be created suitable for further processing and analysis. For the case of Cité Ouvrière, three kinds of data were necessary and available:
- Geographical data, that is two-dimensional georeferenced data, which included –but did not stay limited to– contemporary cadastral plans in CAD and GIS format acquired by the local municipality (Ville de Mulhouse), the Institut National de l’ Information Géographique et Forestière (IGN), and the Agence d’ Urbanisme de la Région Mulhousienne (AURM). Although the data came from different sources they had a certain degree of consistency and served as the base to which primary data from field observations were added manually.. They also had measurable properties were indexical, and therefore reliable, verifiable, and robust for analytical research.
- Historical data, which were essential given the longitudinal aspect of the research. The study relied on both quantitative and qualitative historical data for example old photos and plans from the municipal records (Service des Archives municipales), and the digital platforms of the city (mulhouse.fr) and of the region (mulhouse-alsace.fr). Some historical data were only available in hardcopy form due to their age, requiring considerable effort to collect (often in situ), digitise and synthesise. Yet, their value was unique for they enriched and extended the information available to present; provided well-grounded evidence to support a longitudinal study of patterns of continuity and change in spatial structures; and revealed the dynamic relationship of the social and spatial issues, which are hardly vested in a single moment in time.
- Archival data, a sub-category of historical data, referring to original heritage documents, currently without use, that have been made, received or maintained by public administration organisations. The study used archived maps and building permits for individual houses issued by the municipality before 2000[1]. Most of these data had to be retrieved manually from the local Service des Archives de Mulhouse due to copyright issues[2]. Despite the laborious nature of that process, this data offered to the study a much more vivid understanding of the decisions made by different actors at any particular time in history (Kostourou, 2022) and painted a graphic picture of the order and sequence of changes between synchronic descriptions of the built environment.
3.1. The Problem of Existing Large-Scale Data
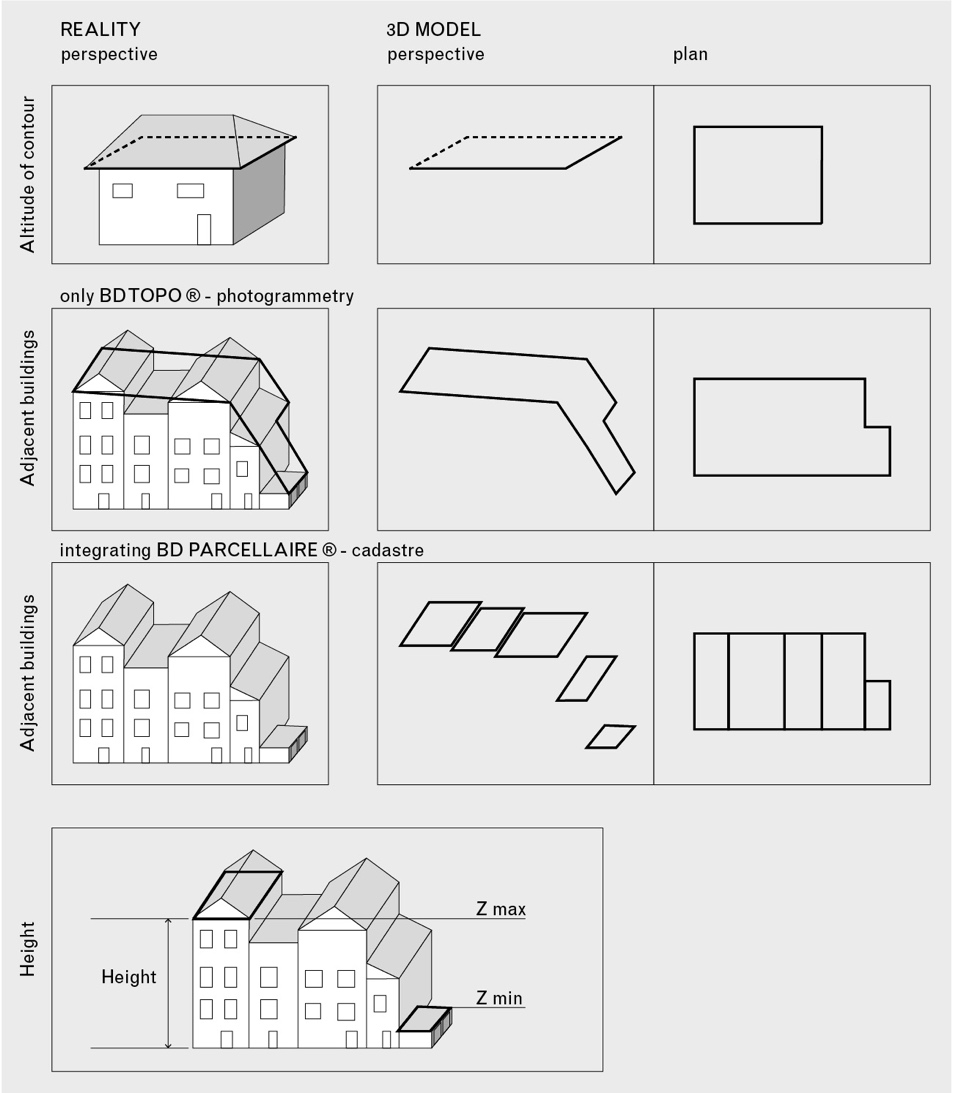
Nonetheless, the historical or archival data did not come in a vectorised format and the existing large-scale geographical data fell short of capturing the three-dimensional built form at the micro level. Available geographical data like the BD TOPO®[3] covered only 95% of the building information. This was because of the way the data had been collected from photogrammetric restitution[4] from an aerial photography (precision between 0.5-1.5m). Figure 1 summarises the modelling constraints in a graphic way.

Firstly, according to the descriptions provided by IGN (2014, p. 70-72), buildings smaller than 20m2 were missing from the dataset, while buildings between 20m2 and 50m2 were disregarded depending on their location and appearance. This meant that volumes such as small annexes, workshops or garages were excluded. Secondly, inner courtyards with a width of less than 10m were not represented as a hole in the built-up area; affecting thus any typological understanding of the built form. Thirdly, adjacent or superimposed buildings with the same land use were generally considered as one and the same object (having only the outer contour marked), if their height difference was less than 10m (or 3 storeys) and the surface area of each building was smaller than 400m2. Last, the building geometries did not match the geometries of the plots (BD PARCELLAIRE®), whose outlines were directly obtained from the cadastre. So, without a complete integration of the two data sources, the formal elements were not superimposable in the GIS platform.
In terms of buildings’ height, micro differences and roof details were lost, although the received dataset covered the entire city. The height of the buildings was calculated as the difference between Zmax (altitude of the contour, that is the upper edge of the buildings, usually the height of gutters) and the ground level elevation. Zmax was calculated by interpolation as the median roof altitudes, considering the altitudes of the contours of the directly contiguous buildings. So, heights between adjacent buildings with small height difference were averaged and unified, and buildings lower than 3m (Zmin) were not captured at all.
4. A New Methodological Framework for the Built Form
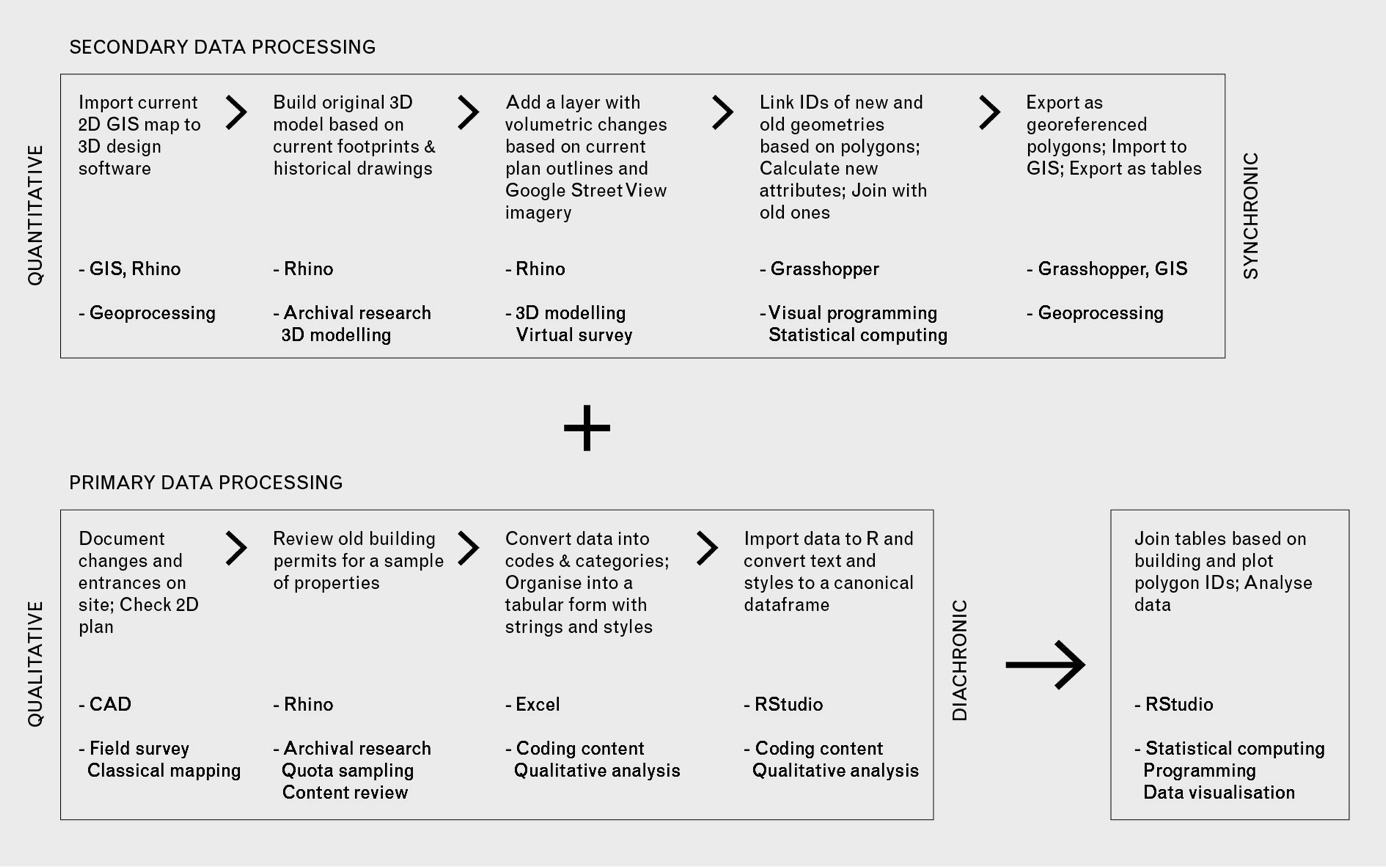
So, there was a clear need to create a new dataset, comprised of a detailed georeferenced three-dimensional model of Cité Ouvrière, that could overcome all the above limitations and document the historical development of the boundaries, shapes and volumes of its plots and houses at the micro level. Figure 2 shows the proposed workflow process for that task, visualising the sequencing of steps, and the tools and methods associated with each of them.

The first set of methods and tools (secondary data processing) concerned the advanced 3D modelling of the built form. Specialised tools, such as GIS, Rhino and Grasshopper, were used to create two detailed and georeferenced 3D models for the entire housing scheme of Cité Ouvrière including all 1,253 buildings and plots in their original (circa 1897) and current state (circa 2018). The final data (larger-scale) was extensive in volume, carried detailed information about the built form, and could be linked to the georeferenced geometries received from the municipal and national institutions.
The second set of methods and tools (primary data processing) aided to gather new data by means of visual observation, classical mapping, drawing, text review, and coding. These data (smaller-scale) were limited in volume and format, and slow to collect; still, they were more detailed, easy to comprehend and synthesise. Their qualitative analysis was mainly descriptive, yet provided insightful information on the local context. .
Both data handling processes yielded datasets in tabular forms, which were then combined and further analysed in the RStudio software. Further analysis on the joined dataset was able to reveal patterns of change at various scales, trace the densification process at the micro level, and measure its impact on the open space consumption in a statistically sound manner (Kostourou, 2021); however, a presentation of these results extend beyond the scope of this paper. What is important to note here is that the R programming language was instrumental in combining and analysing large sets of both categorical and numerical data.
The above process establishes a methodological workflow for a high-resolution multi-scalar quantitative and qualitative analytical approach to study morphological changes over time. It is a smooth workflow between different tools, datasets, and representation modes to ensure the consistency in the resolution and precision of data, the coherence and systematisation of the analytical steps, and the reproducibility of findings. Also, it deals successfully with both the synchronic and diachronic processes of urban transformation and the microscopic and macroscopic scales of spatial investigation.
4.1. Limitations
Despite its comprehensiveness, the workflow features certain limitations. Firstly, the creation of the datasets is a slow and laborious process, and its necessity depends on the research objectives. Secondly, the produced models are simplified representations of the built form, namely volumes for buildings, and polygons for plots. Geometrical and architectural details like facades and interior layouts are not captured, and subsequently, not considered in the analysis. Nonetheless, simplification is a standard part of modelling, and helps focusing on the properties of the object under investigation. Thirdly, important factors that affect the formation and transformation of the built form are not quantified, such as planning controls, zoning, fire codes etc. Although the study looks at building regulations through history, it does not represent them numerically or visually as such thing would be very difficult to do. Of course, some of the above limitations as well as the labour-intensiveness of key stages could potentially be managed by a wider team of researchers. In that case, strict rules need to be set in advance not to compromise the consistency and accuracy of the process.
5. 3D Modelling for Two Chronological Dates (Synchronic Description)
The process started with the building and plot geometries (BD PARCELLAIRE ®) provided by the cadastre. I imported the plan in Rhino software and constructed a 3D model of the original layout as it was designed by the architect Emile Müller between 1853 and 1897. With the help of archival sources, namely the drawings of the original typologies found in the catalogue of the Exposition Universelle of 1889 (Müller & Cacheux, 1889), and historical studies like the one conducted by the sociologist Stéphane Jonas (2003), I was able to retrieve the original three-dimensional description of Cité Ouvrière at the time of its completion in 1897. The first model included 1,253 buildings and plots, their exact dimensions, and roof details. It was composed of four main typologies arrayed in a repetitive layout: 38 terraced (T), 190 back-to-back row houses (BtB), 998 quarter-detached (QD) and 27 semi-detached houses (SD).[5]
I then used this model as a basis to build the second 3D model of the current situation by adding volumes to (or subtracting them from) the exterior of buildings based on the cadastral outlines, and heights estimated from 3D Google View. It should be noted here that no facade details were mapped as they have zero volumetric cost and were thus not relevant for the built density analysis that followed. Also, while the dimensions, heights, and roof details of the new volumes were recorded, this was done approximately in relation to the original measured buildings. However, the 3D version of Google Maps provides effective zoom-in and orbit capabilities that allow an unobstructed view of the geometrical and configurational relations of the volumes and ensure a similar precision range between 0.5-1.5m.
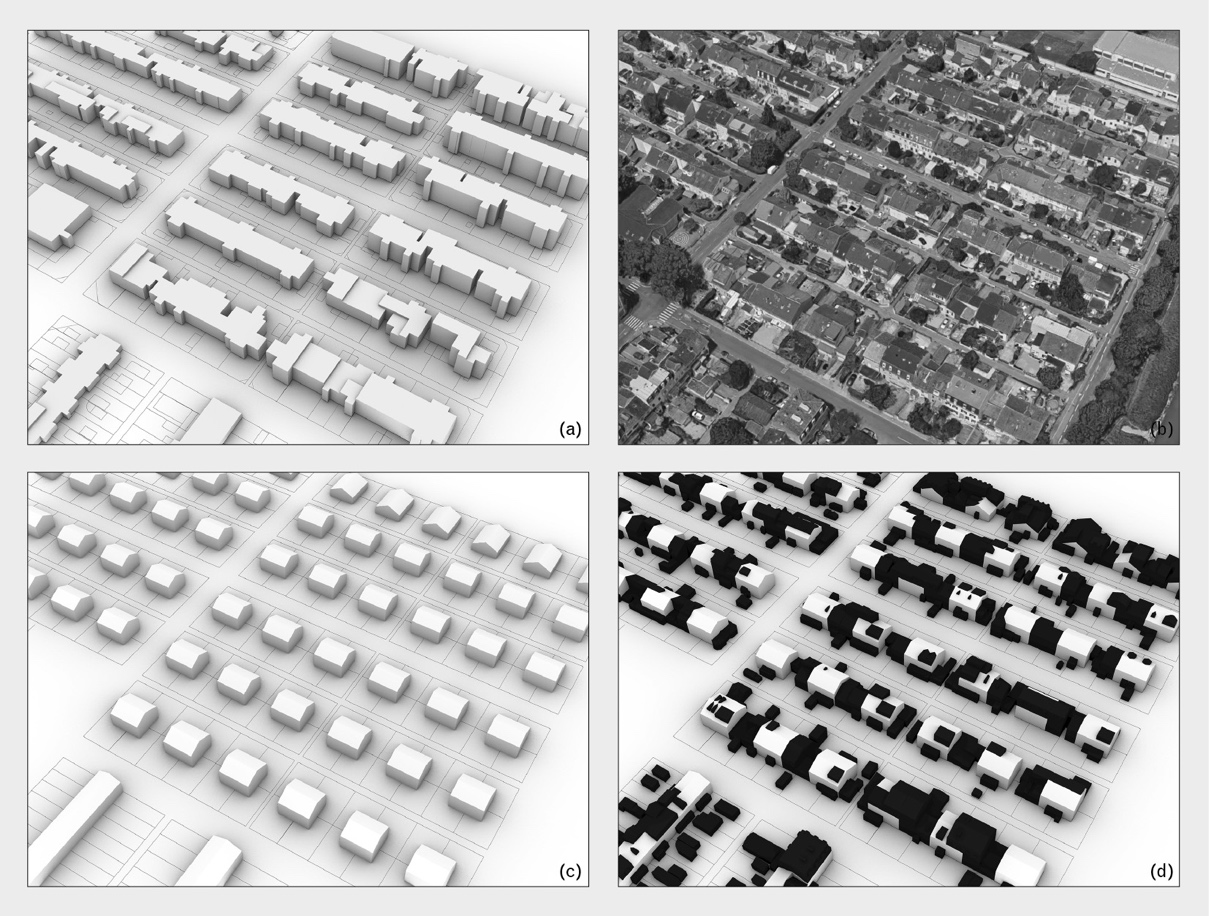
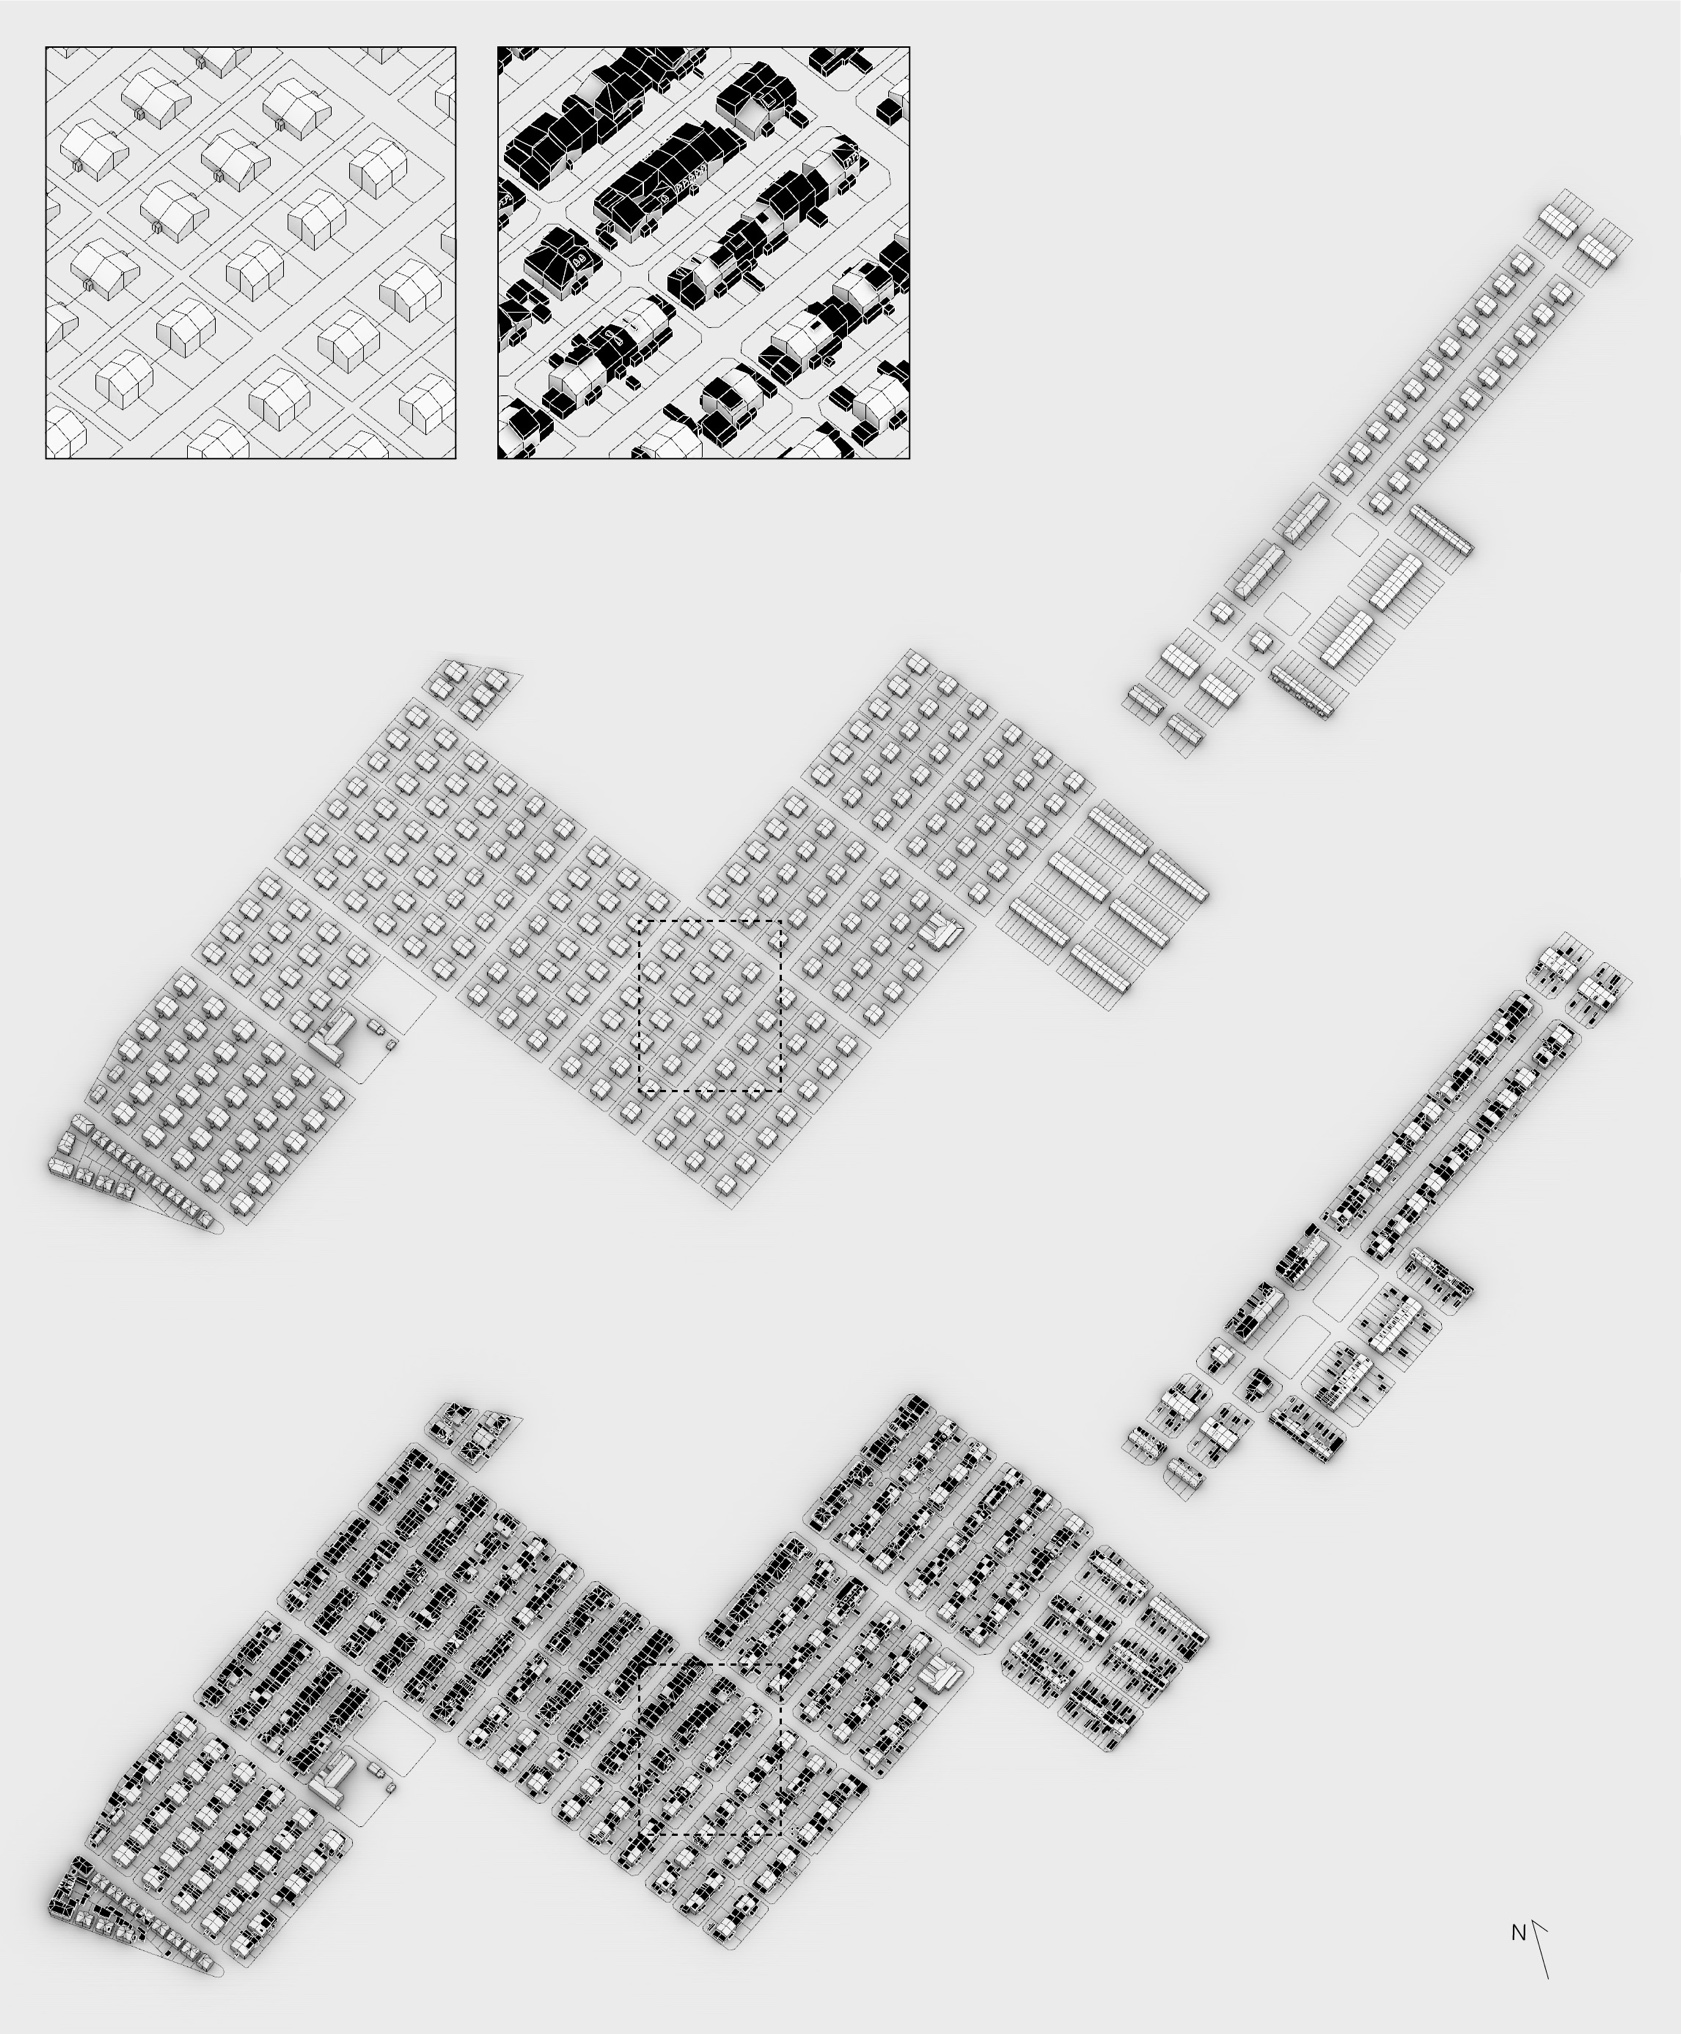
Figure 3 presents the four available representations: (a) the initial model generated from the data received by IGN, the national GIS service; (b) the Google 3D view of the same area; (c) the first Rhino 3D model created for the original Cité Ouvrière in 1897; and (d) the second model where both the original envelopes (white) and their transformations (highlighted in black) exist—and could be measured—separately. It becomes evident now the striking difference between the initial and the final model and how essential was the construction of a more detailed model that carries detailed building-plot information at two chronological dates and responds to the core inquiries of the study.
_built_volumes_extruded_accordi.jpeg)
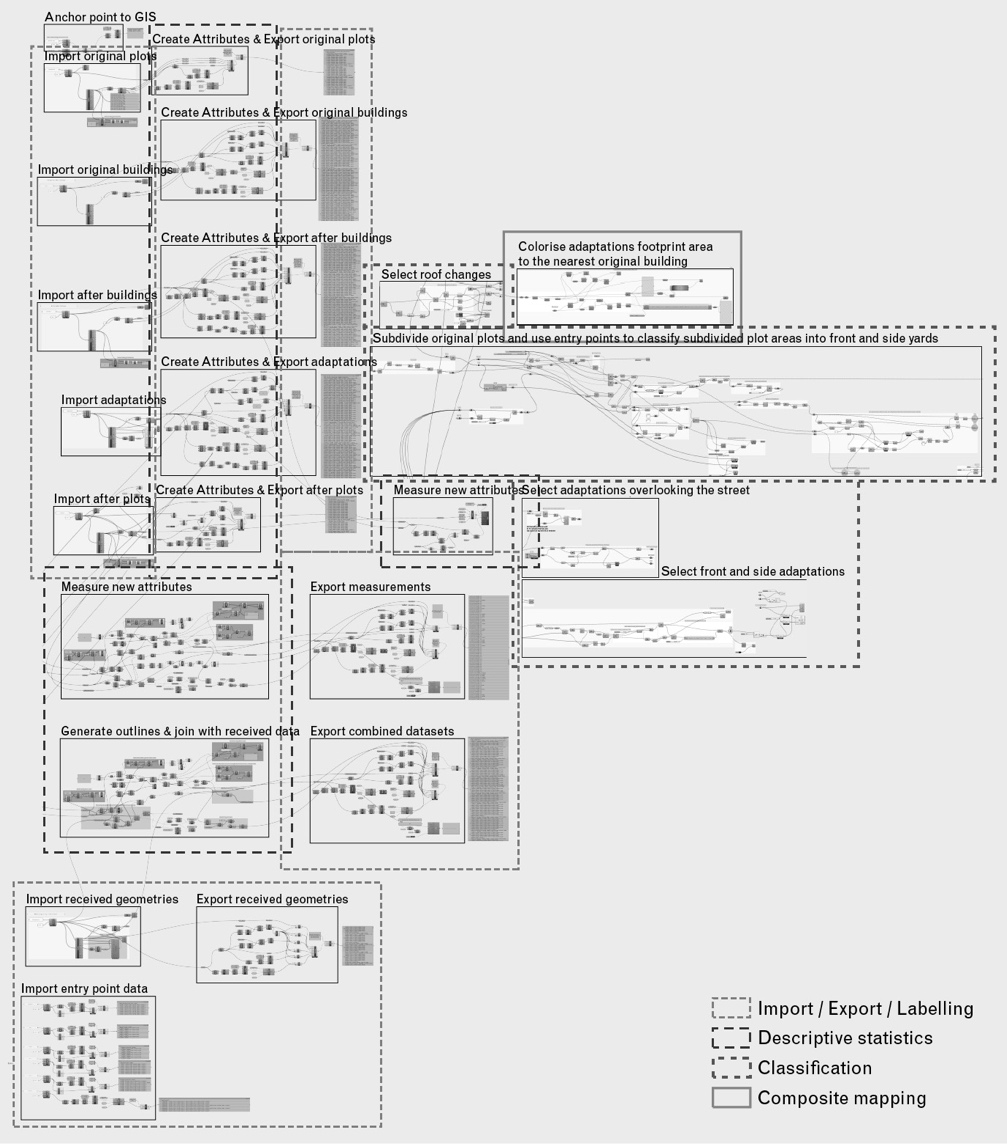
As a final step, I used Rhino’s plugin, Grasshopper, to perform a series of actions: identify the new projected geometries; link the volumes of transformations to the source building and plot geometries; label the formal objects and add new attributes (typology, date of construction, height, area, volume, etc); join these with the initial IGN attributes; and export the entire dataset as georeferenced polygons that could be re-imported to GIS and analysed in R studio. These are only the minimum actions required to complete the modelling task. However, once the Rhino model is created, the processing possibilities within Grasshopper are endless, and include among others descriptive statistics, unsupervised classification based on rules, composite mapping, and generative modelling. Figure 4 is a screenshot of the Grasshopper canvas, showing the basic interrelated components and their functions.
_and_.jpeg)
The final output, both in 2D, 3D, and tabular form, was a unique dataset of approximately 9,700 entries, covering the original and current geometries of plots, buildings, and their transformations. And although further analysis followed, it is important to acknowledge that the digital models (Figure 5) could already visualise morphological changes in a simple and straightforward way, making formal patterns easy to recognise through observation. In other words, the process itself carries its own analytical value. It expands on the “representation framework of urban-form evolution”[6] (Pinho & Oliveira, 2009, p. 122), namely a set of maps that allow the registration, comparison, interaction, and rectification of multiple georeferenced data layers. –. Whilst the authors discuss this in relation to street network maps, the present study suggests further a set of 3D cartographies that can interact with the georeferenced plane data layers, and allow the registration, comparison, and interaction of non-aggregated building information at the micro level.
_and_current_(bottom)_state._there.jpeg)
6. Collecting Data for the Interim Period (Diachronic Description)
While the 3D models helped in creating a space-time description for the analysis of the built form, they stayed limited to two chronological periods, the original and the current one. What happened between these two dates remained unknown, obscuring any understanding of the piecemeal evolution of the built form from the beginning till the present. Hence, the next step focused on the collection of formal data for the intervening period. The process was divided into three steps: (1) field survey, (2) sampling, and (3) content review and analysis.
6.1. Field Survey
I started by conducting a field survey on site. I observed physical changes on the exterior of the houses, their distribution and configuration around the plot. I recorded entry points to the plot and buildings and detected some initial types of change. Field survey was meaningful because it offered familiarity with the context and the spatial culture of the neighbourhood. It also helped to understand the exact type of information needed for the subsequent steps, and to direct the archival research.
Next step was to test and refine these observations by collecting further evidence. While some of the historical maps featured the footprints of certain volumetric changes (mainly horizontal extensions), they did not provide any information about the third dimension. Therefore, I resorted to the Permis de Construire (building permits) issued for individual properties between the end of 19th century and 2000.
6.2. Sampling
The challenge at this stage was that there were more than 1,240 addresses and each address had multiple files to review. The files of building permits were split into ancient (JIIE) covering the period 1900-1970 and post-war (1257W) for the period 1970-2000 with another sub-division for the period 1947-1979 (1132W); all of which were held by the municipal Service des Archives. In addition to this, no archival file could be taken out of the building so the reviewing had to be done during office hours. All these challenges led to the idea of sampling, namely selecting a subset of individual building-plot compounds to focus on, instead of going through the files of all the houses in Cité Ouvrière. This sample had to be representative of the wider population in terms of building typologies and built forms, and large enough to ensure that the results would be reliable estimates of the true characteristics of the population as a whole.
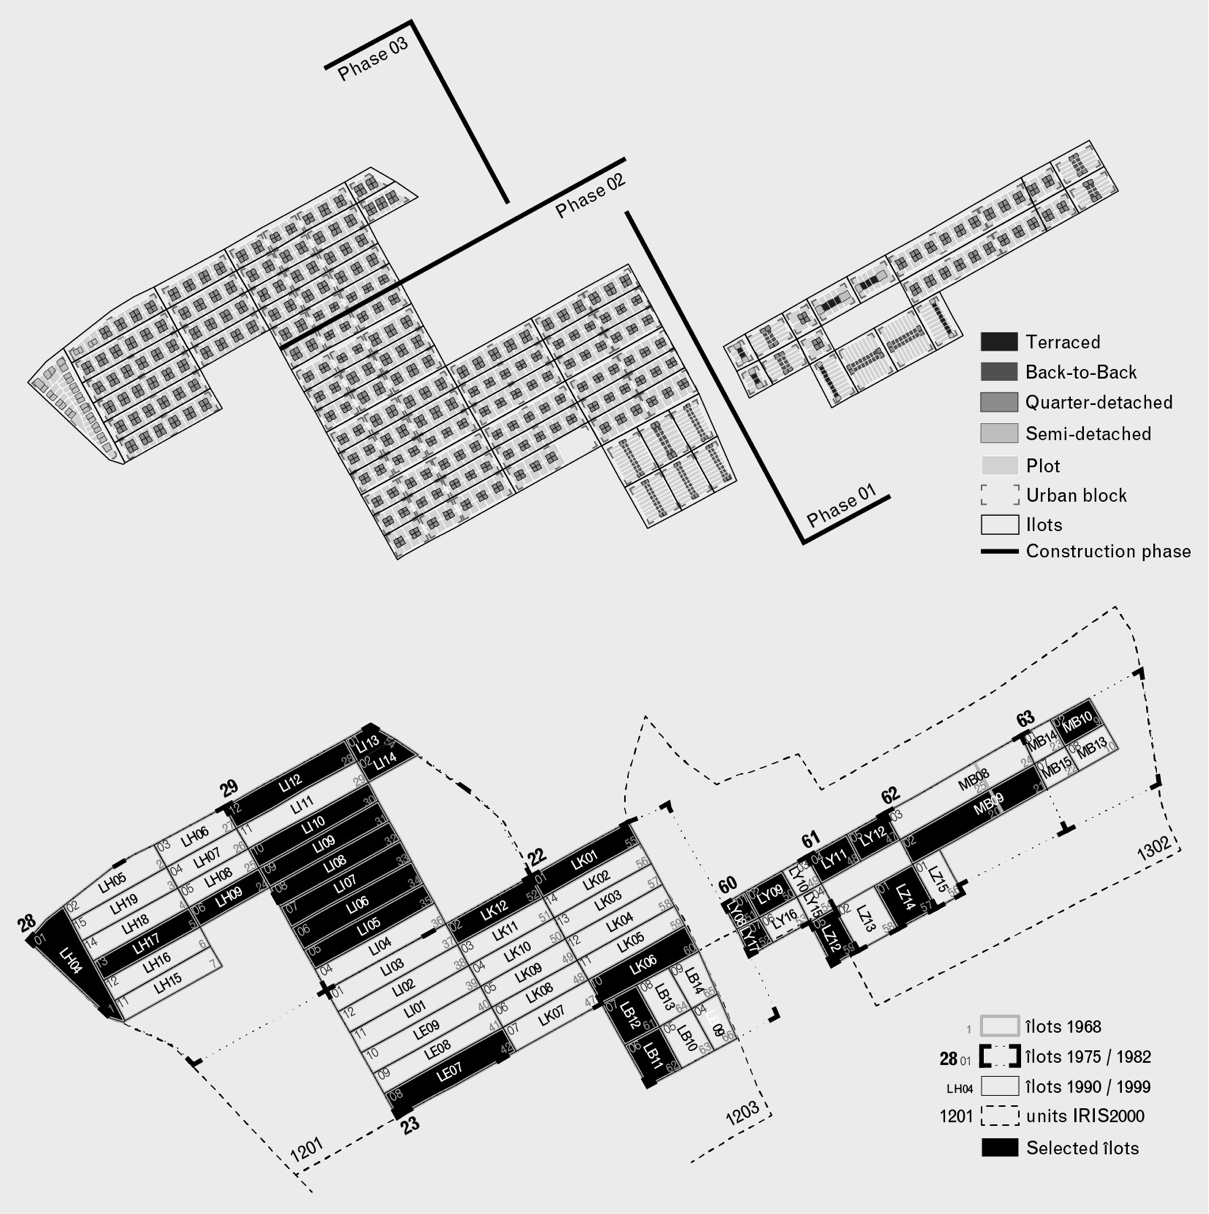
The sample was determined through a standard statistical sampling method called quota sampling. This is a non-probability sampling technique that relies on the ability of the researcher to select elements depending on the existence of sub-groups among the data and the size of these sub-groups so that the sample remains representative of the population proportions within the sub-groups. With regards to the built landscape of Cité Ouvrière, there were several sub-groups: 4 building typologies, 64 statistical blocks in terms of census data (îlots), 102 urban blocks, and 3 construction phases (Figure 6 top).

Sampling was also based on four additional criteria: first, to collect information for houses that fall within the same statistical block (îlot 1990/1999)[7] so that for example subsequent data aggregation to census boundaries could be possible; second, to select statistical blocks that overlook streets with similar centrality values (this came from space syntax analysis on street network), so that the effect of street-facing could be somehow cancelled out as a contributor to physical changes; third, to distribute the sample across the neighbourhood so that it covers both the periphery as well as its centre; and fourth, to select houses in adjacent blocks in order to test the impact of visual and spatial proximity of neighbours on their decisions to carry out modifications. Figure 6 (bottom) illustrates all the sub-groups within Cité Ouvrière, the overlay of different statistical boundaries (see footnote) and highlights the selected sample in black.
From a total of 64 îlots, 27 were selected for the archival research. The sample contained 520 original building-plot compounds—or 498 current ones—and 46 street blocks[8]. The proportions of different sub-groups within the wider population were almost entirely preserved. The percentages in the sample did not deviate more than 5% from those for the entire population and the sample was large enough to ensure that the findings lied within a low margin of error (3% for the total population of houses). In other words, quota sampling was effective in selecting a subset of addresses to focus on that was representative of the building-plot population in Cité Ouvrière.
6.3. Content Review and Analysis
The third step was to review the folders of the 520 selected addresses, wading through official documents and taking photos of any plans attached. The publicly accessible legal documents found therein including building control applications, photos and formal complaints, consisted of extensive and descriptive texts that had to be analysed while reading them. Content analysis[9] is an organisational and analytical approach to evaluate and code textual material in order to extract the essence of its information and help to interpret the meaning of its content (Hsieh & Shannon, 2005). While it is normally used by sociologists to interpret theoretical texts or interviews, here it was employed during the fieldwork to facilitate the data collection.
The content analysis of the archival folders was directed by the initial findings of the earlier field survey. Before visiting the municipal archives, I had already defined a list of volumetric changes that needed validation and refinement. While reviewing the archival material, I would first scan through each document, search for terms related to morphological changes, and then write down the information as labels so that once I was off-site these could be categorised and turned into processable data. The information recorded for each transformation comprised of the year, the owner, the type of change, the reason or context behind it, the dimensions of the volume, its use, the number of prescriptions the construction had to follow, its cost (or level of fine in case of unauthorised changes), any relevant regulations, and the outcome of application—whether successful, executed, or not. Additional information was recorded too, such as the status of ownership, the condition of the building i.e. inhabitable, and transactions like sales or rents. The documents also included informal stories, personal testimonies, complaints, and other anecdotal information, which even if they were not considered as hard facts, provided a rich background for the study. These were transferred as short notes (instead of codes) to shed light on the relationships between neighbours, on the spatial cultures, political regimes, and prevailing societal opinions.
There were several limitations in this process. Firstly, the data collection was not always possible, either because some house addresses had no records or because some of the above-mentioned information were missing. Indeed, the level of detail was not the same among all applications. Secondly, many of the documents were handwritten in stylised letters in French or German, since Mulhouse had been twice under the German occupation; and the terminology was changing from one year to the next, arousing doubt regarding the original meaning. Especially in the ancient building permits, one could find archaic words, which are no longer in everyday use or have lost their particular meaning in current usage. For instance, the German word Wirtschaft could mean a range of things, from restaurant, bar, pub, bistro, business, café, farm to guesthouse, and the French gloriette could be translated to summerhouse, kiosk, gazebo or garden house.
Meanwhile, the process was time consuming and laborious. It could not be reproduced nor automated with regards to archival documents, and hence, the collected data could not be falsified. Instead, it was based on human labour, and was therefore subject to error, particularly when interpreting foreign terms or coding textual material. This was minimised by consulting the archivists and online translation services, and by maintaining consistency in the labelling, predefining most of the categories, and looking at many different types of data in order to synthesise a broader perspective on the topic. Still, the coding was inherently reductive, and a certain loss of information compared to the original content needs to be acknowledged. Although this influenced the level of accuracy for the subsequent analyses, the sample was large enough to consider such deficits negligible.
Instead, this process allowed a certain closeness to data, which in combination with evidence from photos and plans, offered valuable historical and cultural insights. All of the three steps helped gaining an in-depth knowledge of the case study, recognising the emergence of physical transformation, and understanding the role of different actors in the process. Specifically, the content analysis was very useful for it translated textual material into qualitative data of categorical variables, which were in turn converted into statistically analysable data.
7. Pre-processing: Joining Datasets
The last step of the workflow was to combine the information collected from the archival research with the georeferenced data produced by the 3D modelling; in other words, convert the paper-based notes into countable attributes and join them to the vector-based georeferenced geometries.
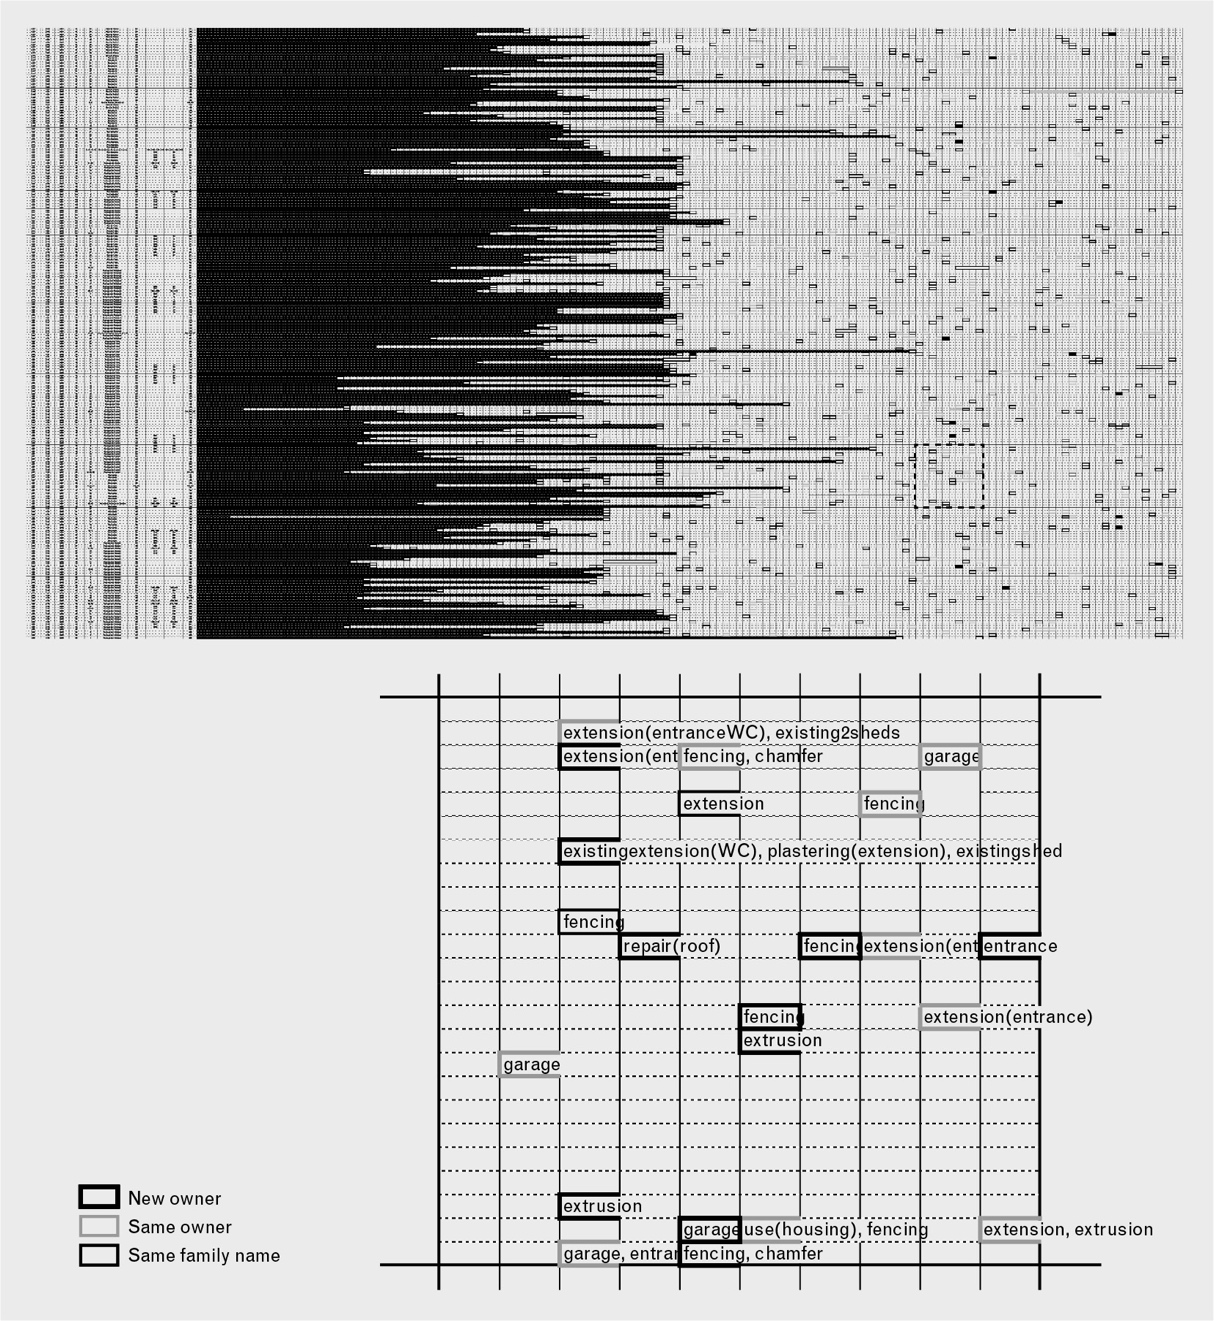
This was carried out by shortening the notes to single words—for example types of changes were coded as extension, extrusion, roof etc—, entering them manually into Excel, and organising them into a tabular form (Figure 7). Each row corresponded to one house address, the first columns contained information from the spatial dataset, such as the code of the statistical block or the ID of the building geometry, while the following columns covered each year from 1853 to 2000. Strings (character-based data) were inserted into the cells, describing all the changes taking place in a particular address on a specific date. Border styles were used to indicate the status of ownership, while drop shadows were added to indicate the condition of the building or financial transaction. The table was then imported to RStudio. The text and styles were converted to a canonical dataframe, which had one row for every single type of change. The new ‘molten’ datatframe was further widened by attaching to it the rest of the gathered information, like the construction cost or the owner’s profession. The final dataset was mostly consisted of nominal data, namely qualitative labels which could not be ordered or measured, but could be statistically analysed in terms of clustering, frequency, counts, or percentages. Eventually, the table was joined to the vector-based spatial dataset based on the matching fields—the ID of the various building and plot geometries—and statistically analysed in R.

8. Conclusions
The paper presented a new methodological workflow for the creation and analysis of detailed data at the building and neighbourhood scale, combining both qualitative data from archival research and quantitative data from geoprocessing and modelling. The process revealed the complexities of the micro morphology which would have been otherwise missed, should available large-scale data and quantitative experiments have been used. By doing so, it provided an insightful understanding of the subjects and objects under investigation.
The main output of the whole process was the production of an entirely new dataset, which records the three-dimensional description of the built form through time. Firstly, a realistic model of the entire housing scheme was built to capture two chronological stages of its morphological evolution (synchronic descriptions). This was made in a way that the original volumes were separated from the subsequent additions and adaptations attached to them, and that each structure was an independent object whose area and volume could be measured. Secondly, the archival work contributed to the creation of a comprehensive set of qualitative data for a sample of 520 houses and a period of 147 years (diachronic description). By looking at the data, the drawings, and the photos, it was possible to re-trace and visualise in 3D the piecemeal trajectory of growth between the original and the current form (see for example Kostourou, 2021, p. 64).
The workflow integrated more traditional with more advanced techniques from the fields of architecture, urban morphology, geography and computer science to map the synchronic and diachronic process of physical change in the built form. It employed existing historical, archival and geographical data, created new qualitative and quantitative data, and processed and combined them to visualise change in 4D, overcoming limitations of handling and combining larger- and smaller-scale data in the abovementioned fields.
However, its main contribution was the production of detailed longitudinal data, which could systematically document microlevel changes in the built environment for over 150 years and explain how local individual processes may contribute to aggregate phenomena of transformation in our neighbourhoods and cities. It also addressed critical points identified by authors such as Batty and Xie (1997), Stanilov and Batty (2011) and Stanilov (2002) regarding the access, vectorisation, and verification of historical data. As Stanilov (2002, p. 174) argues, “documentation on historical development patterns is scarce and sporadic yet it is an invaluable tool in reconstructing our past and predicting our future. […] a detailed set of historical records of past development patterns can be used as a powerful educational and analytical tool for visualizing the dynamics of growth and the identification of development trends.”
Documents produced after 2000 are not kept in the Service des Archives de Mulhouse. For the sake of convenience and consistency, the analysis only relied on archival data found in this building.
Some data are accessible online in webpages operated by the Ville de Mulhouse, Mulhouse Alsace Agglomération (m2A), Bibliothèque nationale de France (BnF), Centre Régional de Documentation Pédagogique de l’Académie de Strasbourg (CRDP) etc.
BD TOPO® is a 3D vectorial geographic description of territorial objects and infrastructural elements, in metric precision and at scales ranging from 1: 2,000 to 1: 50,000. The edition referred here is from April 2016.
Science and art whose subject of study is photography in the intention to collect data leading to dimensional restitutions and to determine the shape and position of an object in space.
These numbers are based on the three-dimensional modelling constructed by the author. Jonas (2003, p. 289) counts 28 terraced (T), 190 back-to-back row houses (BtB), 998 quarter-detached (QD) and 27 semi-detached (SD).
The authors mainly refer to street network maps.
Between 1900 and 2000, there were archived census data for the following dates: 1968, 1975, 1982, 1990, and 1999. Each of these studies was based on different statistical boundaries (INSEE, 2016). For the sampling, I selected the smallest unit of all, the îlot 1990/1999. The analysis on census data is not presented here.
More on the calculations for quota sampling, see Kostourou (2020a, p. 168-171).
In fact, content analysis describes a broad family of methods and practices (Cavanagh, 1997) and their use is rather flexible in the sense that it depends on the research questions and objectives, the data, the researcher, and the boundaries of the analysis.