

1. Introduction
Spatial layouts influence movement. In other words, determining how accessible a space is, is possible by studying the configuration of the context in which the space exists. The study of spatial configuration–the way spaces are linked together–and its association with accessibility and movement has been extensively studied since the proposal of the theory of natural movement in the 1970s and 1980s by Bill Hillier and his colleagues (Hillier & Hanson, 1984; Yamu et al., 2021):
“Natural movement in a grid is the proportion of urban pedestrian movement determined by the grid configuration itself.” (Hillier et al., 1993)
The theory implies that urban form and social behaviour are inherently correlated and analysing one of them can help us understand the other one better. The conception of the theory provided the basis for the development of Space Syntax tools and advancement in the broader field of Spatial Network Analysis.
Spatial Network Analysis is the analysis of the type of network that is both spatially embedded and has geometrical properties (Barthélemy, 2011; Cooper & Chiaradia, 2020). This study uses a Spatial Network Analysis tool called Spatial Design Network Analysis (sDNA) (Cooper & Chiaradia, 2020) to model pedestrian movement in public green spaces in a highly dense and integrated urban district in Singapore.
1.1. sDNA: A Spatial Network Analysis Tool
sDNA is an open-source GIS-compatible and Python/command line tool to analyse multi-level spatial networks (Cooper & Chiaradia, 2020). sDNA computes various network measures of the links, which represent the publicly accessible walking routes, of a spatial network. The network measures indicate the accessibility and connectivity of the links.
Analysing a spatial network using sDNA indicates the potential distribution of movement within a defined radius in the network. Network measures may be analysed under different metric conditions in the software, which define how distance is calculated on the network (Cooper & Chiaradia, 2020). The paper demonstrates a comparative analysis of temporal correlations between metrical considerations in sDNA and observed pedestrian counts in the case of one-north park, and presents insights gained on walkability in the park during a typical weekday and weekend.
2. Case study: one-north park
The study is conducted at one-north Park, a 16-ha linear park located in the centre of one-north. one-north is a research and business park in Singapore, and its masterplan was designed by Zaha Hadid Architects in 2003. Some of the key features of the masterplan are its focus on pedestrian and transport connectivity in one-north, the role of a central park that linked all parts of the district, and the use of the existing undulating topography to influence the built form.
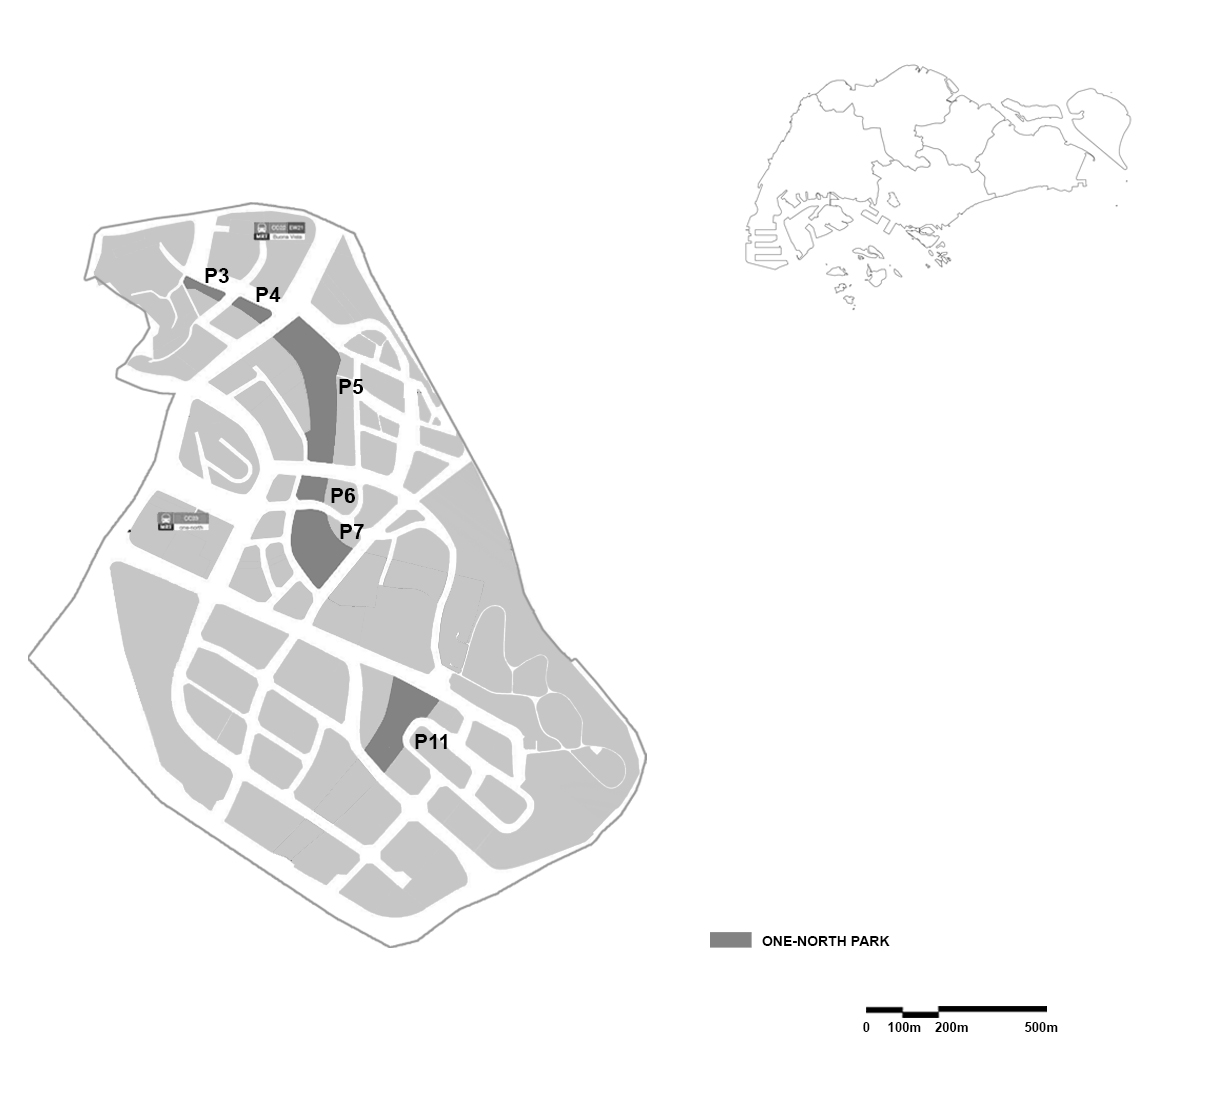
one-north Park is a significant spatial component of the district, providing a green corridor that enables the maximisation of frontage for user access and connecting many of one-north’s research clusters. Although it was planned as a continuous green space, the road network divides the park into multiple parcels. The park currently consists of six built parcels, which are named and numbered according to its managing body, National Parks Board (NParks). In the study, we study the built parcels of the park (illustrated in Figure 1):
-
one-north Park Rochester West (P3): The 0.2-ha park edges along Rochester mall-and-condominium development, and is surrounded primarily by retail commerce. The Rochester Mall also includes office spaces.
-
one-north Park Rochester East (P4): The 0.45-ha park is adjacent to Rochester mall-and-hotel development, and its context includes retail commerce and Rochester residential condominium. The Rochester Mall also includes office spaces.
-
one-north Park Biopolis (P5): The 3.24-ha park is the biggest parcel, and is located on hilly terrain. Its context primarily includes office buildings and a residential condominium one-north Residence.
-
one-north Park Fusionopolis North (P6): The 0.58-ha park was sensitively developed based on principles of environmental sustainability. Abutting an office building, the park has diverse vegetation to attract biodiversity.
-
one-north Park Fusionopolis South (P7): The 2.44-ha park is established as a nature sanctuary to support existing bird populations. Surrounded by office buildings, it includes a singular boardwalk across the parcel for pedestrian connectivity.
-
one-north Park Mediapolis (P11): The 1.98-ha park is an elevated park above a carpark and other infrastructural facilities. It is adjacent to an office building, and its context primarily includes office buildings and a private school.

The different characteristics and contexts of the parcels of one-north Park indicate that we can expect different pedestrian patterns across a given day, for e.g., walking across a park to access an office at the start and end of business hours, meandering along a park in the evening, running at the park during the early hours of the day, etc. These patterns will also differ across weekends and weekdays.
3. Research Aim and Framework
A common methodology of Spatial Network Analysis using sDNA is the use of empirical studies of pedestrian movement that corroborate the results of sDNA (Cooper & Chiaradia, 2015, 2020; Li et al., 2021). However, there are few studies that attempt to quantitatively correlate the sDNA results and observed pedestrian flows on a temporal basis.
The aim of the study is to correlate Spatial Network Analysis results with temporal pedestrian movement flows under different metric considerations, in order to develop a predictive pedestrian model in one-north park. The research will also present insights on the role of the one-north Park as a significant spatial connector in pedestrian trips during typical weekdays and weekends. The insights gained from the study will determine which analytical model has the highest correlation with observed pedestrian movement flows in one-north Park. The deviations between the network analysis results and observed pedestrian counts will be analysed in future research to improve the robustness of the network model. The spatial model developed from the ongoing study can be used as an effective simulative tool for future design of spaces in the park and their effect on pedestrian movement.
The framework of the study is three-fold: Pedestrian Mobility Data Collection, Spatial Network Analysis, and Spatial-temporal Correlational analysis.
4. Methodology
4.1. Pedestrian Mobility Data Collection
Pedestrian movement data was collected by setting up people counters in the parcels of one-north Park. Bi-directional outdoor people counters using infrared sensors were strategically placed at entry points and key locations in each parcel of the park. Each pair of counters was tied to existing poles or mounted on supporting poles to form an invisible gate, so that the people passing through the gate were counted.
18 pairs of people counters were installed in the six parcels, over two phases. In each phase, pedestrian movement in three parcels was recorded on an hourly basis every day over 2-4 weeks. At the end of the two phases, a total of 31 locations were covered using the people counters. The data was averaged to hourly counts on a typical weekday and a typical weekend for analysis.
4.2. Spatial Network Analysis
A spatial network model was constructed using Rhino and ArcGIS to represent the pedestrian routes in one-north (illustrated in Figure 2). The network was constructed with links (polylines) which each represent the centre of a publicly accessible walking path or space. The network considered the full detail of multi-level publicly accessible spaces in all the parcels of one-north Park, and their 100m radius context. Beyond the localised radius, the rest of one-north district was constructed using a simplified model of footpaths and pedestrian indoor connections. To avoid edge effects (Gil, 2015), the radius of the entire network was maintained at 1000m, to include one-north district boundary.
The network was then imported into ArcGIS, which uses the sDNA tool as a plugin for analysis. Since the topography of one-north is undulating, slope is a significant variable in the Spatial Network Analysis of one-north Park. The outdoor pedestrian street network was draped over a terrain dataset to reflect the slope of the context. The network was assembled by placing the multi-level pedestrian network of publicly accessible spaces in buildings on the street network model. This step helped account for height gain in pedestrian movement through level difference as well as slope. Using sDNA, the network was checked for errors and missed intersections, and prepared for analysis. The network within the localised radius was analysed using the sDNA Integral Analysis function.

The study focussed on one key network measure used in sDNA: Betweenness Centrality. Betweenness is the sum total of shortest paths from each node on the network to every other node, which traverse a given link or node (Cooper & Chiaradia, 2020). Betweenness can be understood as an expression of pedestrian flow.
Using sDNA, analysis of the network model was conducted using three metric considerations:
-
Accounts for Euclidean metric and height gain:
The Euclidean metric assumes that pedestrians take the shortest paths on journeys. Pedestrians commuting to and from work may tend to follow Euclidean geodesics, as they know the shortcuts.
-
Accounts for Angular metric and height gain:
The Angular metric assumes that pedestrians take the most direct paths on journeys, i.e., routes with least angular turns. These routes are not always the shortest paths on walking journeys. Pedestrians, unless they are very familiar with the area, generally tend to minimise their turns when walking, because the routes are easier to remember and thus retrace.
-
Accounts for Hybrid metric and height gain:
A mix of both these patterns can be calculated in the Hybrid metric (the formula used in the study accounts for 50% Angular and 50% Euclidean geodesics).
4.3. Spatial-temporal Correlational Analysis
To test the relationship between spatial network models at different metric considerations and observed averaged pedestrian counts, a bivariate linear regression analysis was adopted for all the network models. The links in the network and the people counter locations were spatially joined to correlate Betweenness values with the people counts.
5. Results
5.1. Pedestrian Mobility Mapping

Based on the data collected from the pedestrian counters, the following observations are made:
-
Overall, during a typical day, the highest pedestrian flow activity in one-north Park is noticed during the time period 12 noon to 1 pm.
-
There is pedestrian activity in the park during weekdays as well as weekends. The context of the park is unlike a typical monofunctional business park, and can explain the pedestrian movement patterns. During a typical weekday, three time periods see sharp peaks of flows: 8-9am, 12-3pm, and 6-7pm. Since one-north predominantly has office buildings, it can be understood that higher pedestrian activity can be noticed in the most of the parcels of the park at the start and end of business hours, as well as during lunch break hours. During a typical weekend, there is a gradual increase in pedestrian flows from 6-9am, then the flows fluctuate by small amounts until 6pm, then steadily decrease. They can be explained by the presence of residential and retail spaces in the context of the park.
-
Pedestrian flows differ in the individual parcels of the park. During the peak hours in the weekday, the following observations are made:
-
During 8-9am, the highest flows are observed in the office entrance at P6 (21) and an entrance to P4 (9).
-
During 12-1pm, the highest flows are observed in the pathway edging along P3 (5) and in the office entrance at P6 (21).
-
During 6-7pm, the highest flows are observed in the pathway edging along P3 (5), an entrance to P4 (9), and the office entrance in P6 (21).
These observations indicate that the parcels P4, and P6 are used as transitory spaces when pedestrians commute to and from office.
-
-
The corresponding time periods in the weekend see different flows in the park parcels. However, some pedestrian patterns are consistent across the weekday and weekend:
-
During 8-9am, the highest pedestrian movement is observed in an entrance to the P4(9). High flows are also observed in another entrance to P4 (6) and the pathway along P3 (5). These high flows are not noticed in the other parcels during the same time, and hence can be attributed to urban attractors near one-north Park Rochester condominium.
-
During 12-1pm, the highest flows are observed in the pathway edging along P3 (5).
-
During 6-7pm, the highest flows are observed in the pathway edging along P3 (5) and an entrance to P4 (9).
The highly mixed-use context of P3 and P4 can explain the consistently high pedestrian flows across weekdays and weekends. These flows can indicate pedestrian activity to the mall, to the residential condominium, the hotel, and seating spaces within the parcels themselves.
-
-
In P3 (one-north Park Rochester West), the pathway edging the park parcel and leading to the Rochester condominium (5) consistently shows higher flows than other entry points to the parcel during the weekday and weekend. The path also sees high flows during the time period 6-8pm in the weekend.
This indicates that the perimeter of the parcel is highly and consistently used, but the parcel itself sees fluctuating through-movement in a typical day. Hence the parcel P3 is not observed as a significant connector for pedestrian trips.
-
In P4 (one-north Park Rochester East), three entry points to the parcel (6, 7, 9) show the highest flows during 6-8pm in the weekday. The three paths along the primary street North Buona Vista Road (9, 10, 11) show high flows during 8-9am and 6-7pm in the weekday, typical of pedestrian movement at the start and end of business hours. This indicates that pedestrians through these entry points likely go to office spaces in Rochester mall and hotel.
Outside of business peak hours, the parcel sees comparable flows during corresponding hours in the weekday and the weekend. This means that the parcel sees pedestrian activity consistently during the weekday and the weekend. Hence the parcel P4 is observed as a significant connector for pedestrian trips.
-
In P5 (one-north Park Biopolis), the entrance from the primary street North Buona Vista Road (12) sees the highest pedestrian flows during 8-9am and 6-7pm. A similar peak is observed in the weekend, during 9-10am and 6-7pm. While these flows are not as high as those observed in P4, it can be understood that the parcel is used as a transitory space during these time periods.
Smaller secondary entrances to the park, via Biopolis (13) and one-north Residences (17) see peak flows during 12-1pm in the weekday, but these entrances see significantly lower flows in the corresponding time periods during the weekend. Since the context of the parcel predominantly includes office buildings, it can be argued that the park is used as a connector for office-eating-venue-office trips. The parcel is used as a connector during few certain time periods of the day, but sees less activity compared to the other parcels. The relatively sporadic pedestrian activity, despite its size and central location, implies that the parcel P5 is generally a spatial barrier in the area.
-
In P6 (one-north Park Fusionopolis North), all people counters show a consistent pattern of peak hours during the weekday: 8-9am, 12-2pm, 6-7pm. Since the parcel abuts an office building, these pedestrian flows can be assumed to represent the movement of office employees.
However, this pattern is not observable during the corresponding hours in the weekend. In the weekend, excluding the start and end of typical business hours, values in corresponding time periods are comparable. Since the offices in the context are observed to be closed during the weekends, the park is consistently used by non-employees as well, which means that the parcel is an urban attractor by itself. The rich biodiversity and sensitive landscape design can explain the frequent flows within the parcel, despite its context being monofunctional. From these observations, it is concluded that the parcel P6 is a significant connector for pedestrian trips.
-
In P7 (one-north Park Fusionopolis South), the entry points to the boardwalk (24, 25) see high pedestrian flows during 7-8am in the weekday. One possible explanation for this pattern is that the parcel is an urban attractor, meaning people visit the park during this time. There is no clear pattern during the business hours in the weekday, which indicates that it is not used as a shortcut between office buildings. The weekend sees significantly lower pedestrian activity. The parcel P7 is observed as a spatial barrier for pedestrian trips in the area.
-
In P11 (one-north Park Mediapolis), the entrance from the neighbouring private school (27) sees peak flows during 3-4pm, but there is a significant drop during the corresponding time period in the weekend. This indicates that the flows represent school children movement patterns.
The entry point from the carpark below (28) sees high flows both in the weekend and weekday, and peaks at 1-2pm in the weekday. Another entrance to the parcel, which is closest to the adjacent office building (31) and is a pedestrian ramp, sees a peak at 12-1pm in the weekday, but has significantly lower flows during other hours of the weekday, as well as the weekend. The difference in pedestrian flows in the two entrances indicates that the ramp is only used by people already in the office building or the vicinity, and not as a primary entrance to the parcel. While there are no consistent patterns to imply that the parcel P11 is used by office commuters, it is consistently used as a connector just after school hours.
The entrances to the parcel that are furthest from the office building (29, 30) see very less flows and no consistent patterns during the weekday, but show substantially higher flows during the weekend, peaking at 7-8pm. The evening flows indicate that the parcel is frequented in the weekend. Hence the parcel P11 can be understood as a spatial connector during certain hours and also as an urban attractor.
5.2. Spatial-temporal Correlational Analysis

The bivariate linear regression analysis shows that:
-
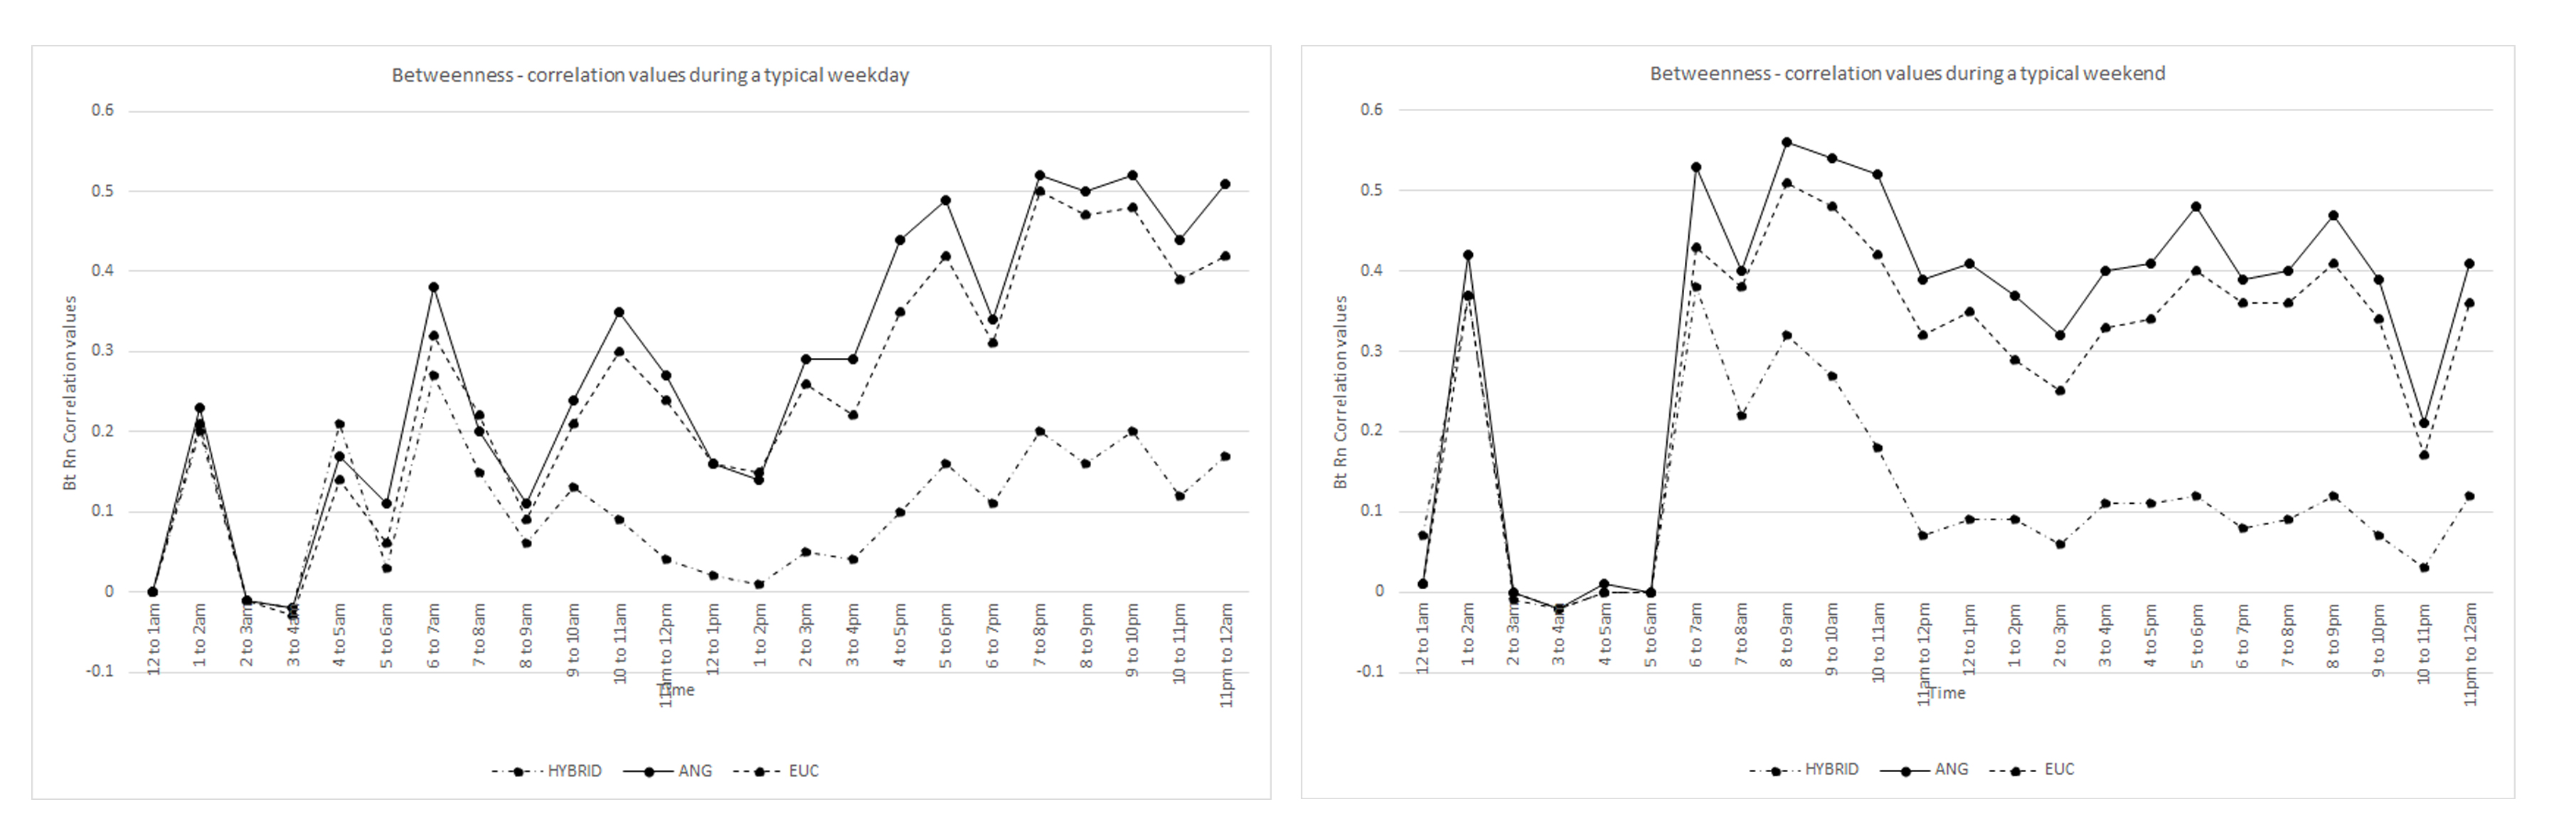
The Betweenness-Angular model consistently shows the highest correlation with the observed pedestrian patterns in the weekday and the weekend. Based on this observation, it can be argued that pedestrians tend to minimise their turns when walking rather than take the shortest paths.
-
All three models have higher correlations with observed pedestrian patterns in the weekend than in the weekday. One possible explanation for this difference is that walking patterns are not generally office-oriented journeys in the weekend, hence the influence of the spatial configuration may be higher on pedestrian patterns in the weekend than the weekday.
-
There is little to no correlation until 5am. During the stray hours of the night, pedestrian trips are made to specific urban attractors (for e.g., grocery store, café, etc.), and will not be influenced by the spatial configuration itself.
-
During the weekday, the Betweenness-Angular correlation varies from 0.11 (little to no correlation) to 0.52 (high correlation). The lowest correlation values (after 5am) are noticed during 8-9am, 12-4pm, and 6-7pm. Interestingly, the peak pedestrian weekday flows are observed within the same time periods, which represent trips by pedestrians commuting to and from office. This means that the spatial configuration alone cannot explain pedestrian trips during these time periods. It implies that a multivariate regression analysis is required in future research to include independent variables such as distance to closest transit egress, the attractiveness of urban points of interest, etc.
-
The Betweenness-Angular correlation value range is shorter in the weekend (0.3 to 0.56) than the weekday. The difference between the correlation values of the Betweenness-Angular model and the Betweenness-Euclidean model is higher in the weekend than the weekday. Further investigation is needed to understand the overlapping relationship of the Angular and Euclidean models and the low correlation of the Hybrid model.
6. Discussion
The comparison of metrical considerations in the sDNA analysis of the network model can be used to understand how people generally choose to walk in their origin-destination journeys. Applying it temporally, i.e., during a typical weekday and weekend, shows different pedestrian patterns in one-north Park, implying that the influence of the spatial configuration may be higher on pedestrian patterns in the weekend than the weekday. The Betweenness-Angular spatial network model can be used to understand pedestrian movement flow distribution in future research in one-north Park. The fluctuating correlation values in different time periods imply that there is a need to account for urban attractors in the spatial network to improve the study of spatial accessibility. A multivariate regression analysis will be conducted in future research to improve the robustness of the model. Future design proposals in the parcels of the park can be simulated using the model to understand changes in predictable pedestrian movement patterns.
The parcels of one-north Park are observed as transitory spaces in different times in weekdays and weekends. one-north Park Rochester East and one-north Park Fusionopolis North are significant spatial connectors in pedestrian trips. The rest of the parcels are observed as connectors for short origin-destination trips during certain time periods. one-north Park Fusionopolis South and one-north Park Mediapolis can be understood better as urban attractors themselves, rather than connectors, due to high pedestrian movement flows in weekday early mornings and weekend evenings. one-north Park Biopolis and one-north Park Fusionopolis South see sporadic pedestrian activity, and don’t generally act as connectors between spaces in their context. They can be seen as spatial barriers in the area. Future research in one-north will focus on the pedestrian occupancy of the spaces in the park parcels, by studying bidirectional pedestrian flows in the parcels.
When the parcels are compared to each other, the observed pedestrian flows and the sDNA results show that the connectivity of the parcels clearly influences pedestrian movement, for e.g., one-north Park Fusionopolis South offers pedestrians a singular boardwalk across the parcel, while one-north Park Fusionopolis North offers the choice of a meandering network of routes. Pedestrian movement in the parcels is also clearly dependent on the mixed-use context, for e.g., one-north Park Rochester East and one-north Mediapolis are both parcels that abut buildings, but see different pedestrian flows. The context of one-north Park Rochester East, which has a hotel, a mall, a residential condominium and eateries, is likely a factor that explains the consistently high pedestrian flows through the parcel. The context of one-north Mediapolis is monofunctional, and the parcel is surrounded by office buildings and few eateries. The next stage of the study will use multivariate regression analysis to expand on this insight by exploring the complexity of a weighted spatial network model.
This study is a part of a larger ongoing research on spatial integration in one-north. The data collected from the pedestrian mobility mapping stage in the larger site may change the correlation analysis of the study, and the validation of the metric considerations of the model. The research has certain limitations. While the Spatial Network Analysis shows that urban morphology influences pedestrian movement patterns, pedestrian behaviour can also be influenced by other aspatial factors: the sensorial experiences of spaces, perception of safety, etc. The study also faced logistical limitations. The outdoor conditions for people counters sometimes resulted in erroneous readings, caused by the entry of insects or the accidental displacement of devices by passersby. Ongoing construction work blocked some paths in the parcels for 1-2 weeks, skewing certain sensor readings.
7. Conclusion
The study seeks to utilise Spatial Network Analysis to analyse the distribution of pedestrian movement in one-north Park. The multi-level public pedestrian network model is analysed for Betweenness centrality with three metric considerations: Euclidean, Angular and Hybrid, and the Betweenness-Angular model is found to have the highest correlation with observed pedestrian flows. The use of an empirical sensor-based study allows real-world pedestrian mobility mapping, and observations based on pedestrian flow trends provide insights on the use of one-north Park as a spatial connector. These insights become the basis for improving the robustness of the network analysis and identifying key gaps in pedestrian connectivity of the park in future research. Unbuilt design proposals in the park can be simulated using the sDNA Betweenness-Angular model to understand changes in predictable pedestrian movement patterns. A robust sDNA network model can inform planning and design decisions on how to improve the park’s connectivity and spatial usage. The presented study is part of a larger ongoing research project on spatial integration in one-north and contributes to the development of a novel multi-disciplinary methodology using Spatial Network Analysis. The methodology can be applied to other park systems, to understand existing walking patterns and use, and predict changes in pedestrian movement patterns due to redesign of spaces in the parks.
Acknowledgement
This research was conducted at the Future Cities Lab Global at Singapore-ETH Centre. Future Cities Lab Global is supported and funded by the National Research Foundation, Prime Minister’s Office, Singapore under its Campus for Research Excellence and Technological Enterprise (CREATE) programme and ETH Zurich (ETHZ), with additional contributions from the National University of Singapore (NUS), Nanyang Technological University (NTU), Singapore and the Singapore University of Technology and Design (SUTD).